Wallboards

Author: Łukasz Strumiński
Created: 2023-02-13. Updated: 2023-02-22.
Wallboards are interactive whiteboards often used in customer service companies, which display the performance indicators of the entire department, such as the number of customers waiting in line and service level of agents.
The data is displayed in real time (refreshed every 10 seconds), so managers (e.g., a department manager) can monitor the workflow in real time, which allows for optimization and proper management of consultants' work (including determining the length of breaks, planning the number of employees on each shift).
Important...⚠️
Correct synchronization of the device's time with the NTP server is necessary for the correct display of Wallboards.
From the Administration tab, select Advanced → Wallboards.
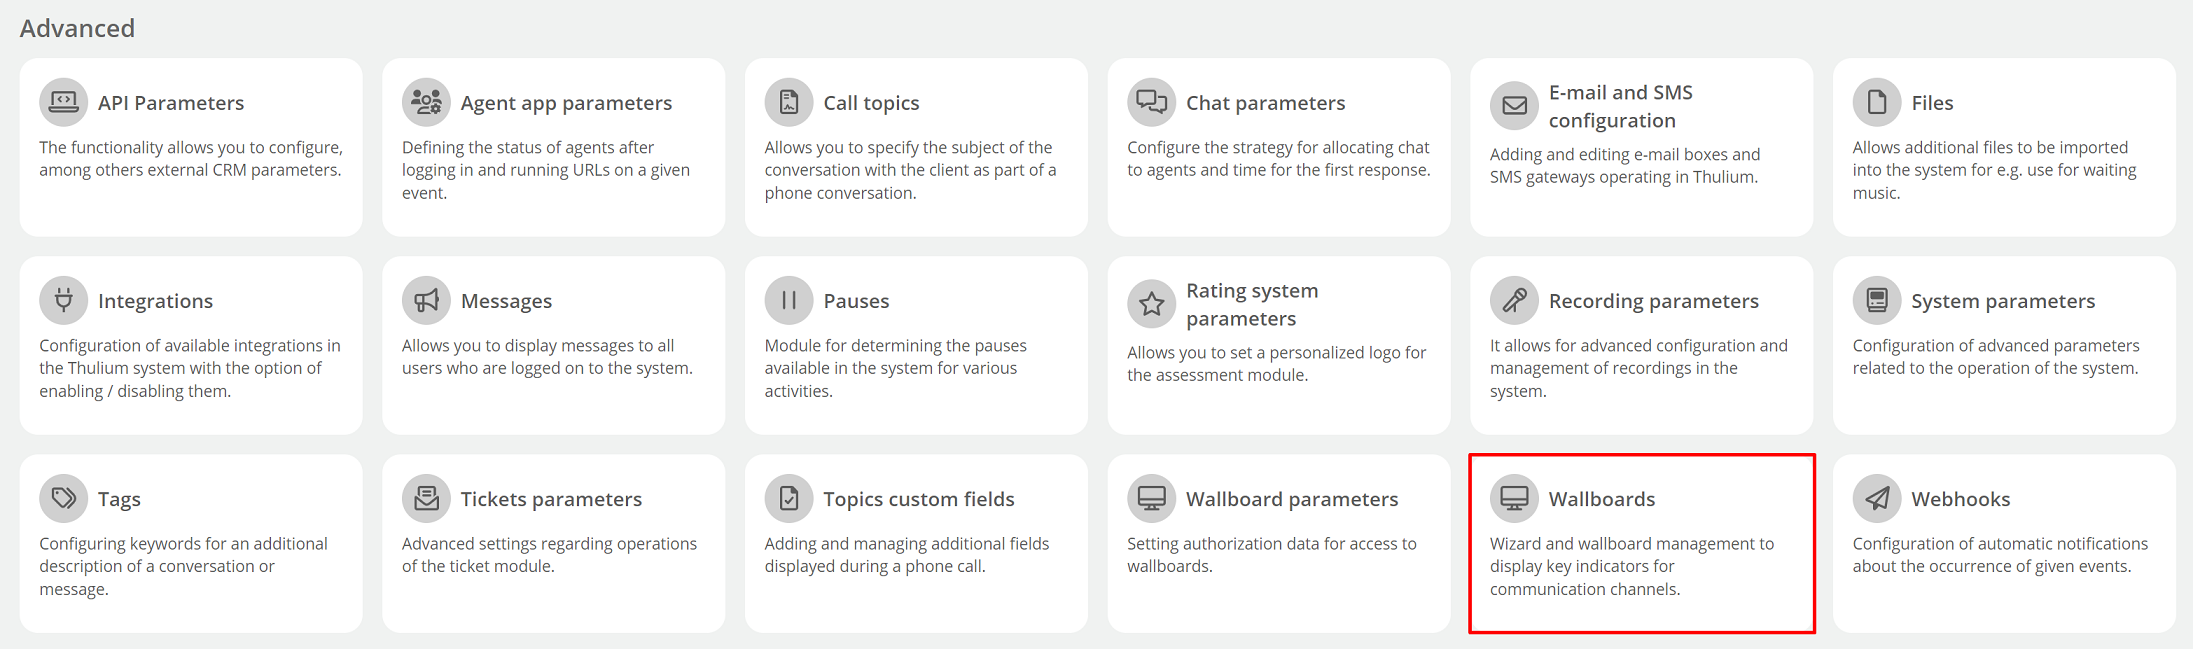
A list of available wallboards will appear on the screen.
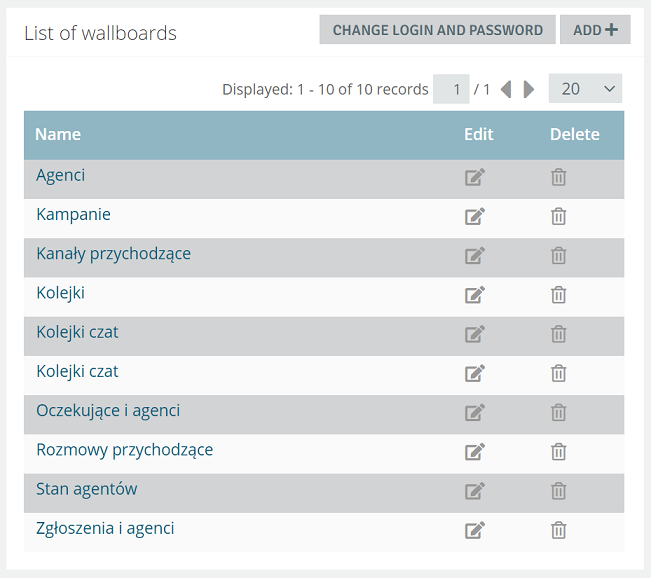
The table consists of three columns:
- Name - the name of the wallboard,
- Edit - the ability to edit the wallboard,
- Delete - possibility to delete the wallboard.
By clicking on the name of the wallboard, you will be asked to enter your username and password.
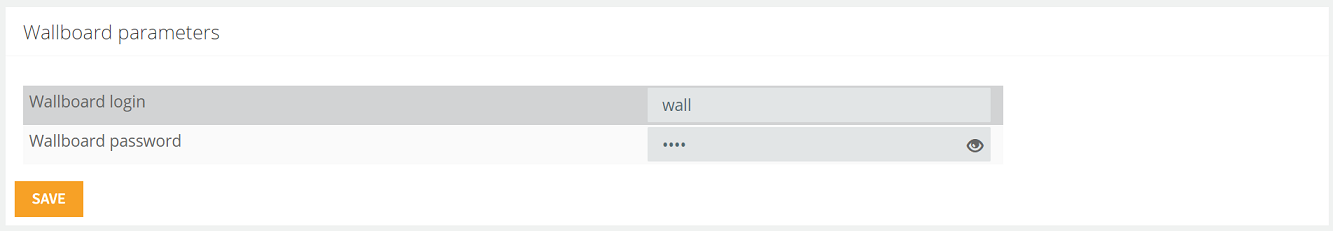
Clicking on the  button will take you to the Wallboard parameters tab, where you can see the current password and change it to your own, easier to remember.
By clicking the  button, you have the ability to add and configure a wallboard.
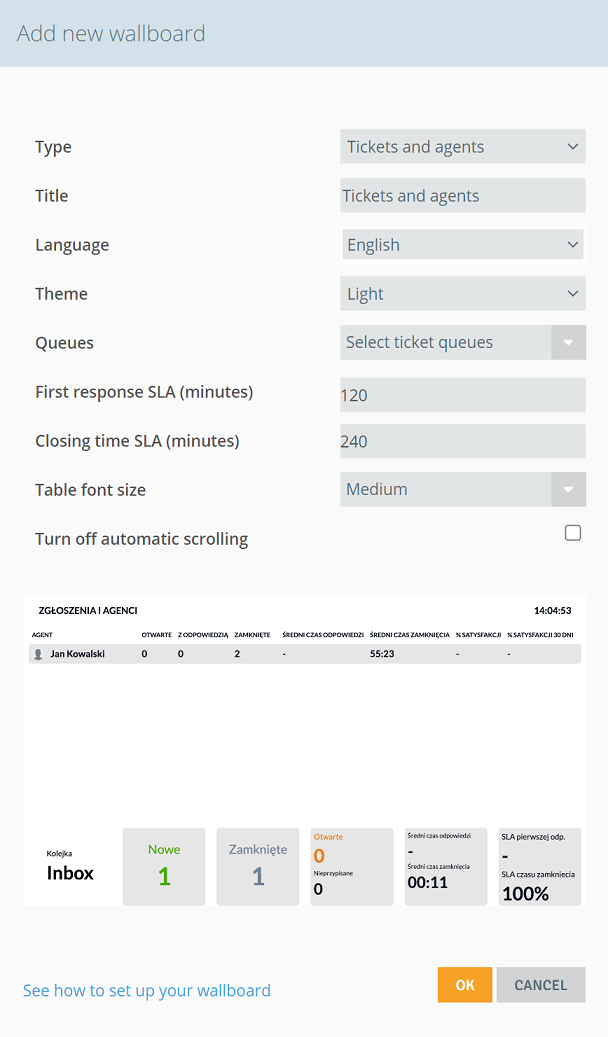
You can choose the type of wallboard, change its title, theme (light or dark) and select the language (Polish or English). In addition, for each type of wallboard there are parameters that you can configure in it according to your needs (such as service level or the time from which data is presented on the wallboard) including the font size in the table.
Available wallboards:
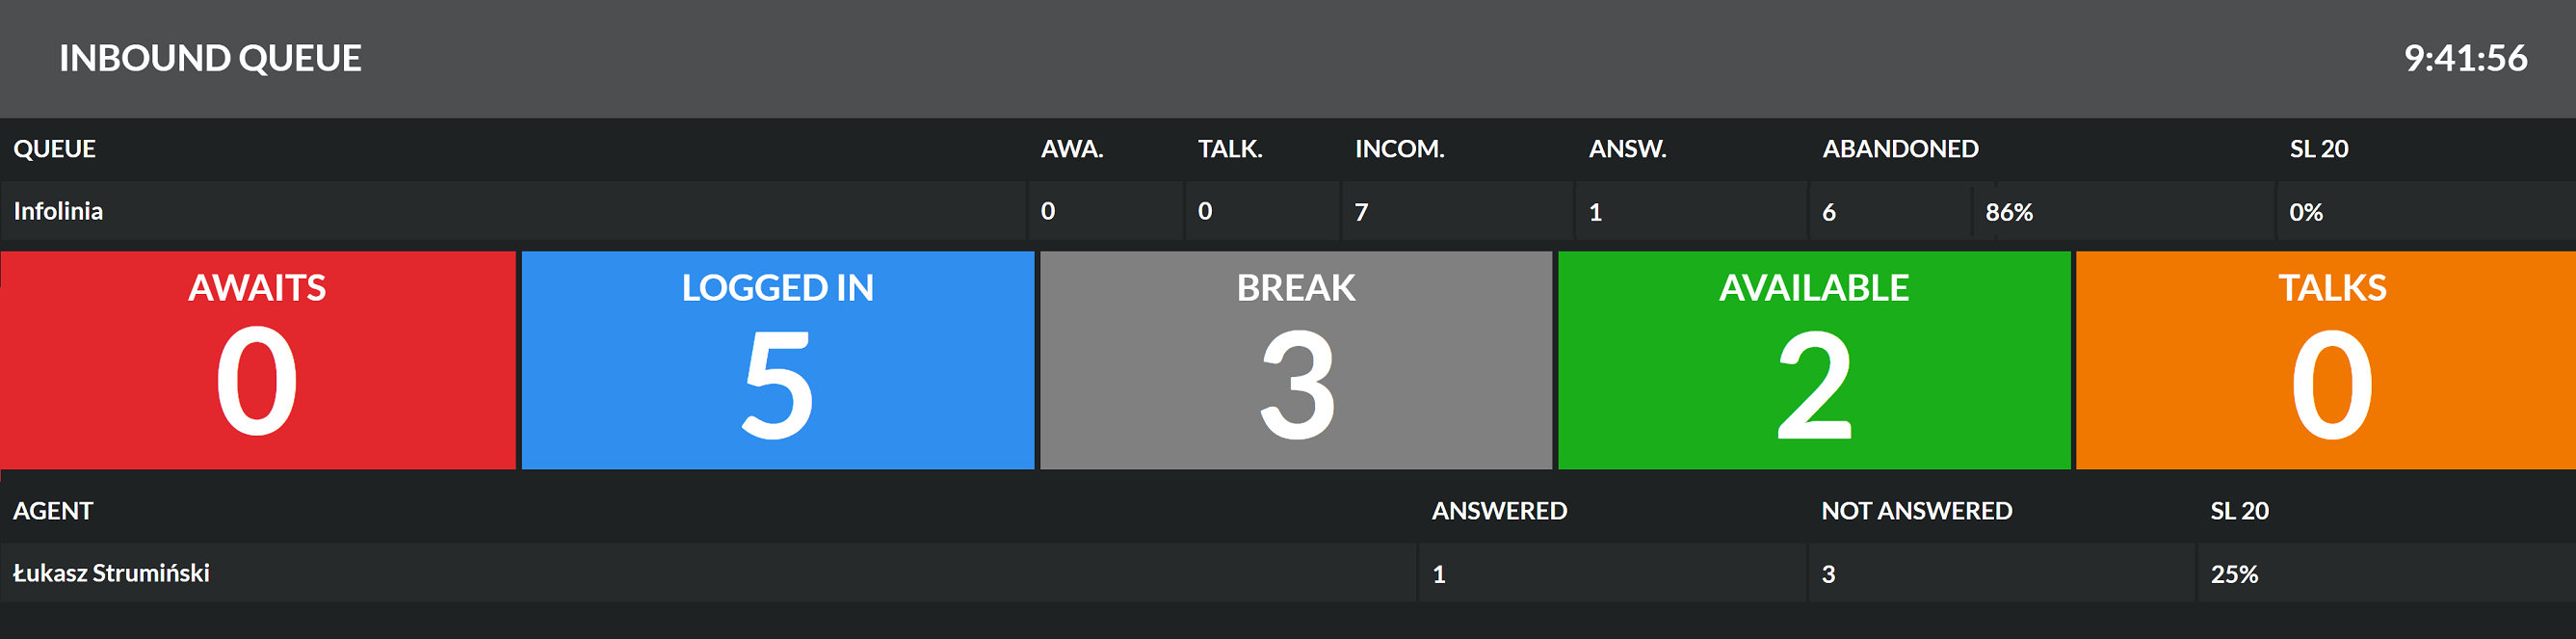
Wallboard Queue and agents contains information on incoming calls and agent activity in the selected queue.
The screen shows such information as:
- number of calls waiting,
- number of conversations in progress,
- number of incoming calls,
- number of answered calls,
- number and percentage of abandoned calls (the customer hung up before the agent answered the call),
- service level parameter SL 20 (the ratio of the number of calls answered before 20 seconds to the number of incoming calls).
Important...⚠️
Service level on wallboard from queues does not take into account calls abandoned before the threshold.
In addition, information related to agent activity appears - you see, among other things, the number of agents logged in and talking, as well as how many of them are taking a break. For each agent, the number of received and missed calls is presented, as well as the service level of agents with a threshold of 10 seconds.
Parameters you can set up:
- queue for which data is displayed (you can choose only one queue),
- time that is taken into account for the service level threshold of the queue (default - 20 seconds),
- time from which data are presented on the wallboard (default - from 1 hour).
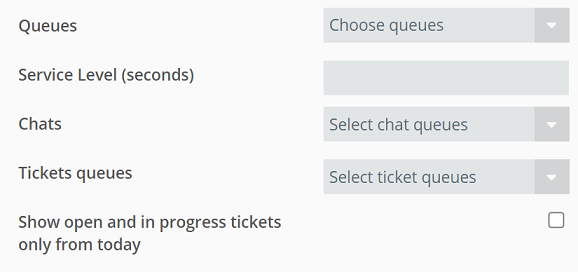
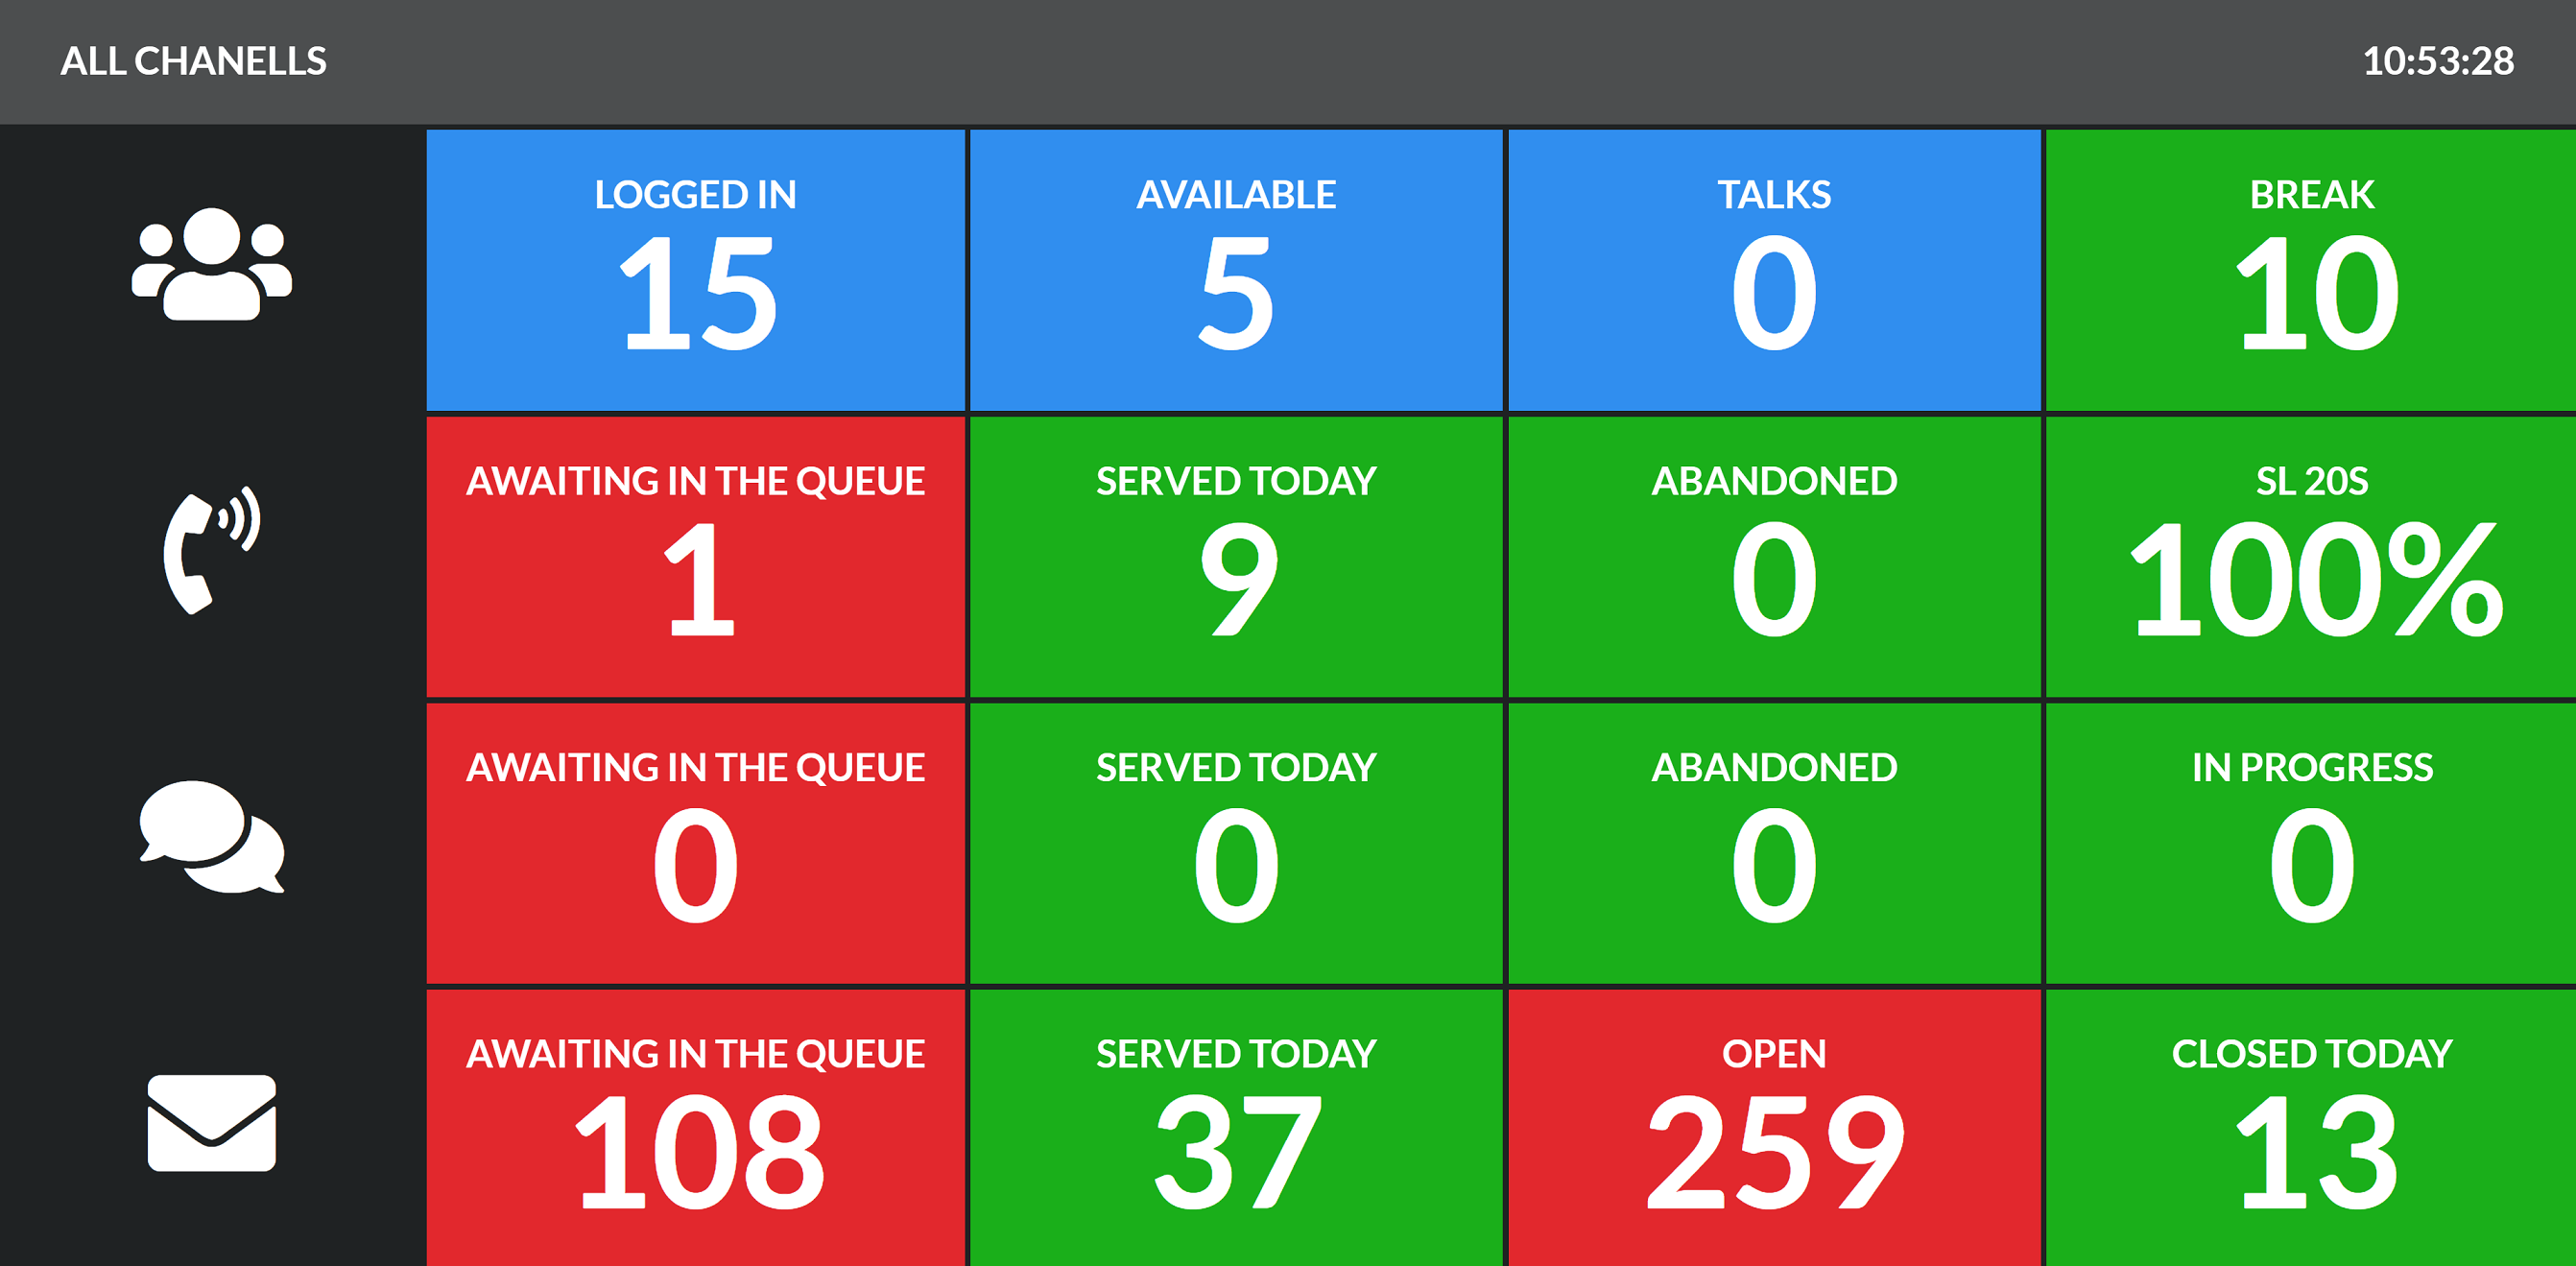
Wallboard All channels is a multifunctional wallboard containing data on agent activity, incoming calls, chats and tickets.
- Agents - Number of agents logged in, on Free status, making calls and taking a break,
- Infoline - number of customers waiting in queue, number of calls answered on a given day and abandoned (customer hung up before agent answered the call), service level 20S,
- Chats - number of chats queued, serviced on a given day, abandoned (the customer left the chat before it was assigned to an agent) and the number of chats currently in progress,
- Tickets - number of tickets queued, served on a given day, opened and closed (resolved) on a given day.
Parameters you can set up:
- infoline queues for which data is displayed (default - all queues),
- time that is taken into account for the service level threshold of the infoline queue (default - 20 seconds),
- chat queues for which data is displayed (default - all queues),
- queues of tickets for which data is displayed (default - all queues),
- the period of time for which data related to tickets are displayed, for queued and open requests (default - all in given statuses).
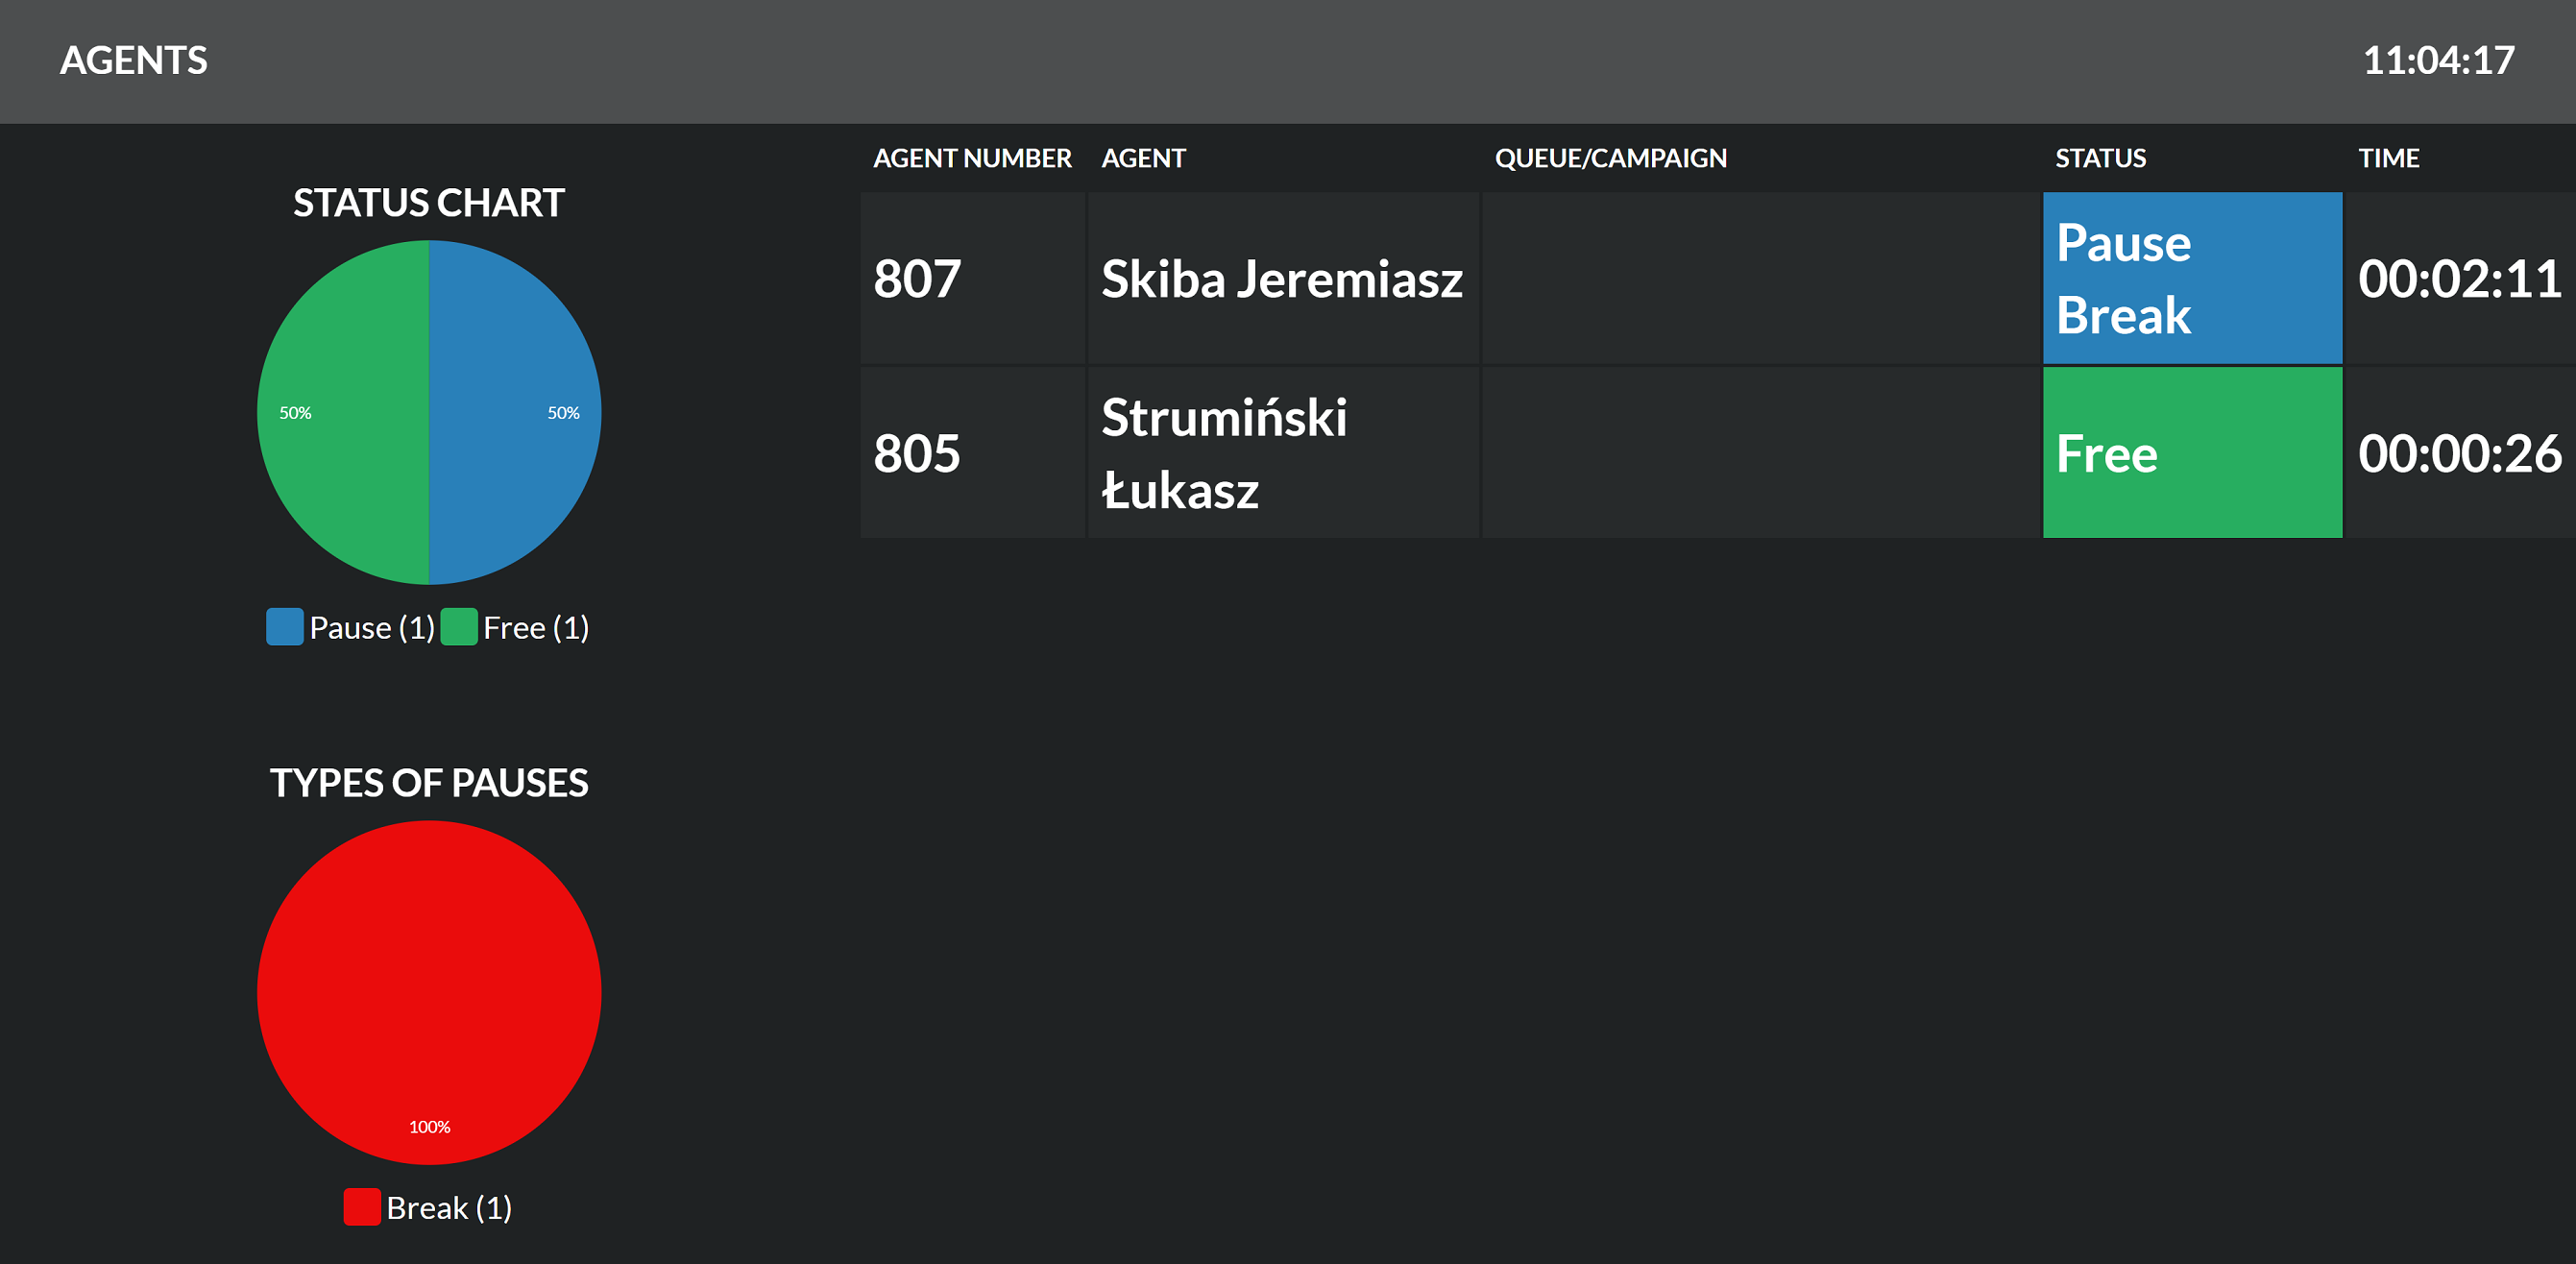
The Agents wallboard shows agent activity. You can see how long your employees (name and agent extension number) have been on a particular status (Free/Break) in particular queues and campaigns.
Aggregate status information is presented in pie charts - the first one shows the percentage distribution of agents on Free/Break status, while the second one distinguishes between different types of pauses.
Parameters you can set up:
- possibility to sort by agent number.
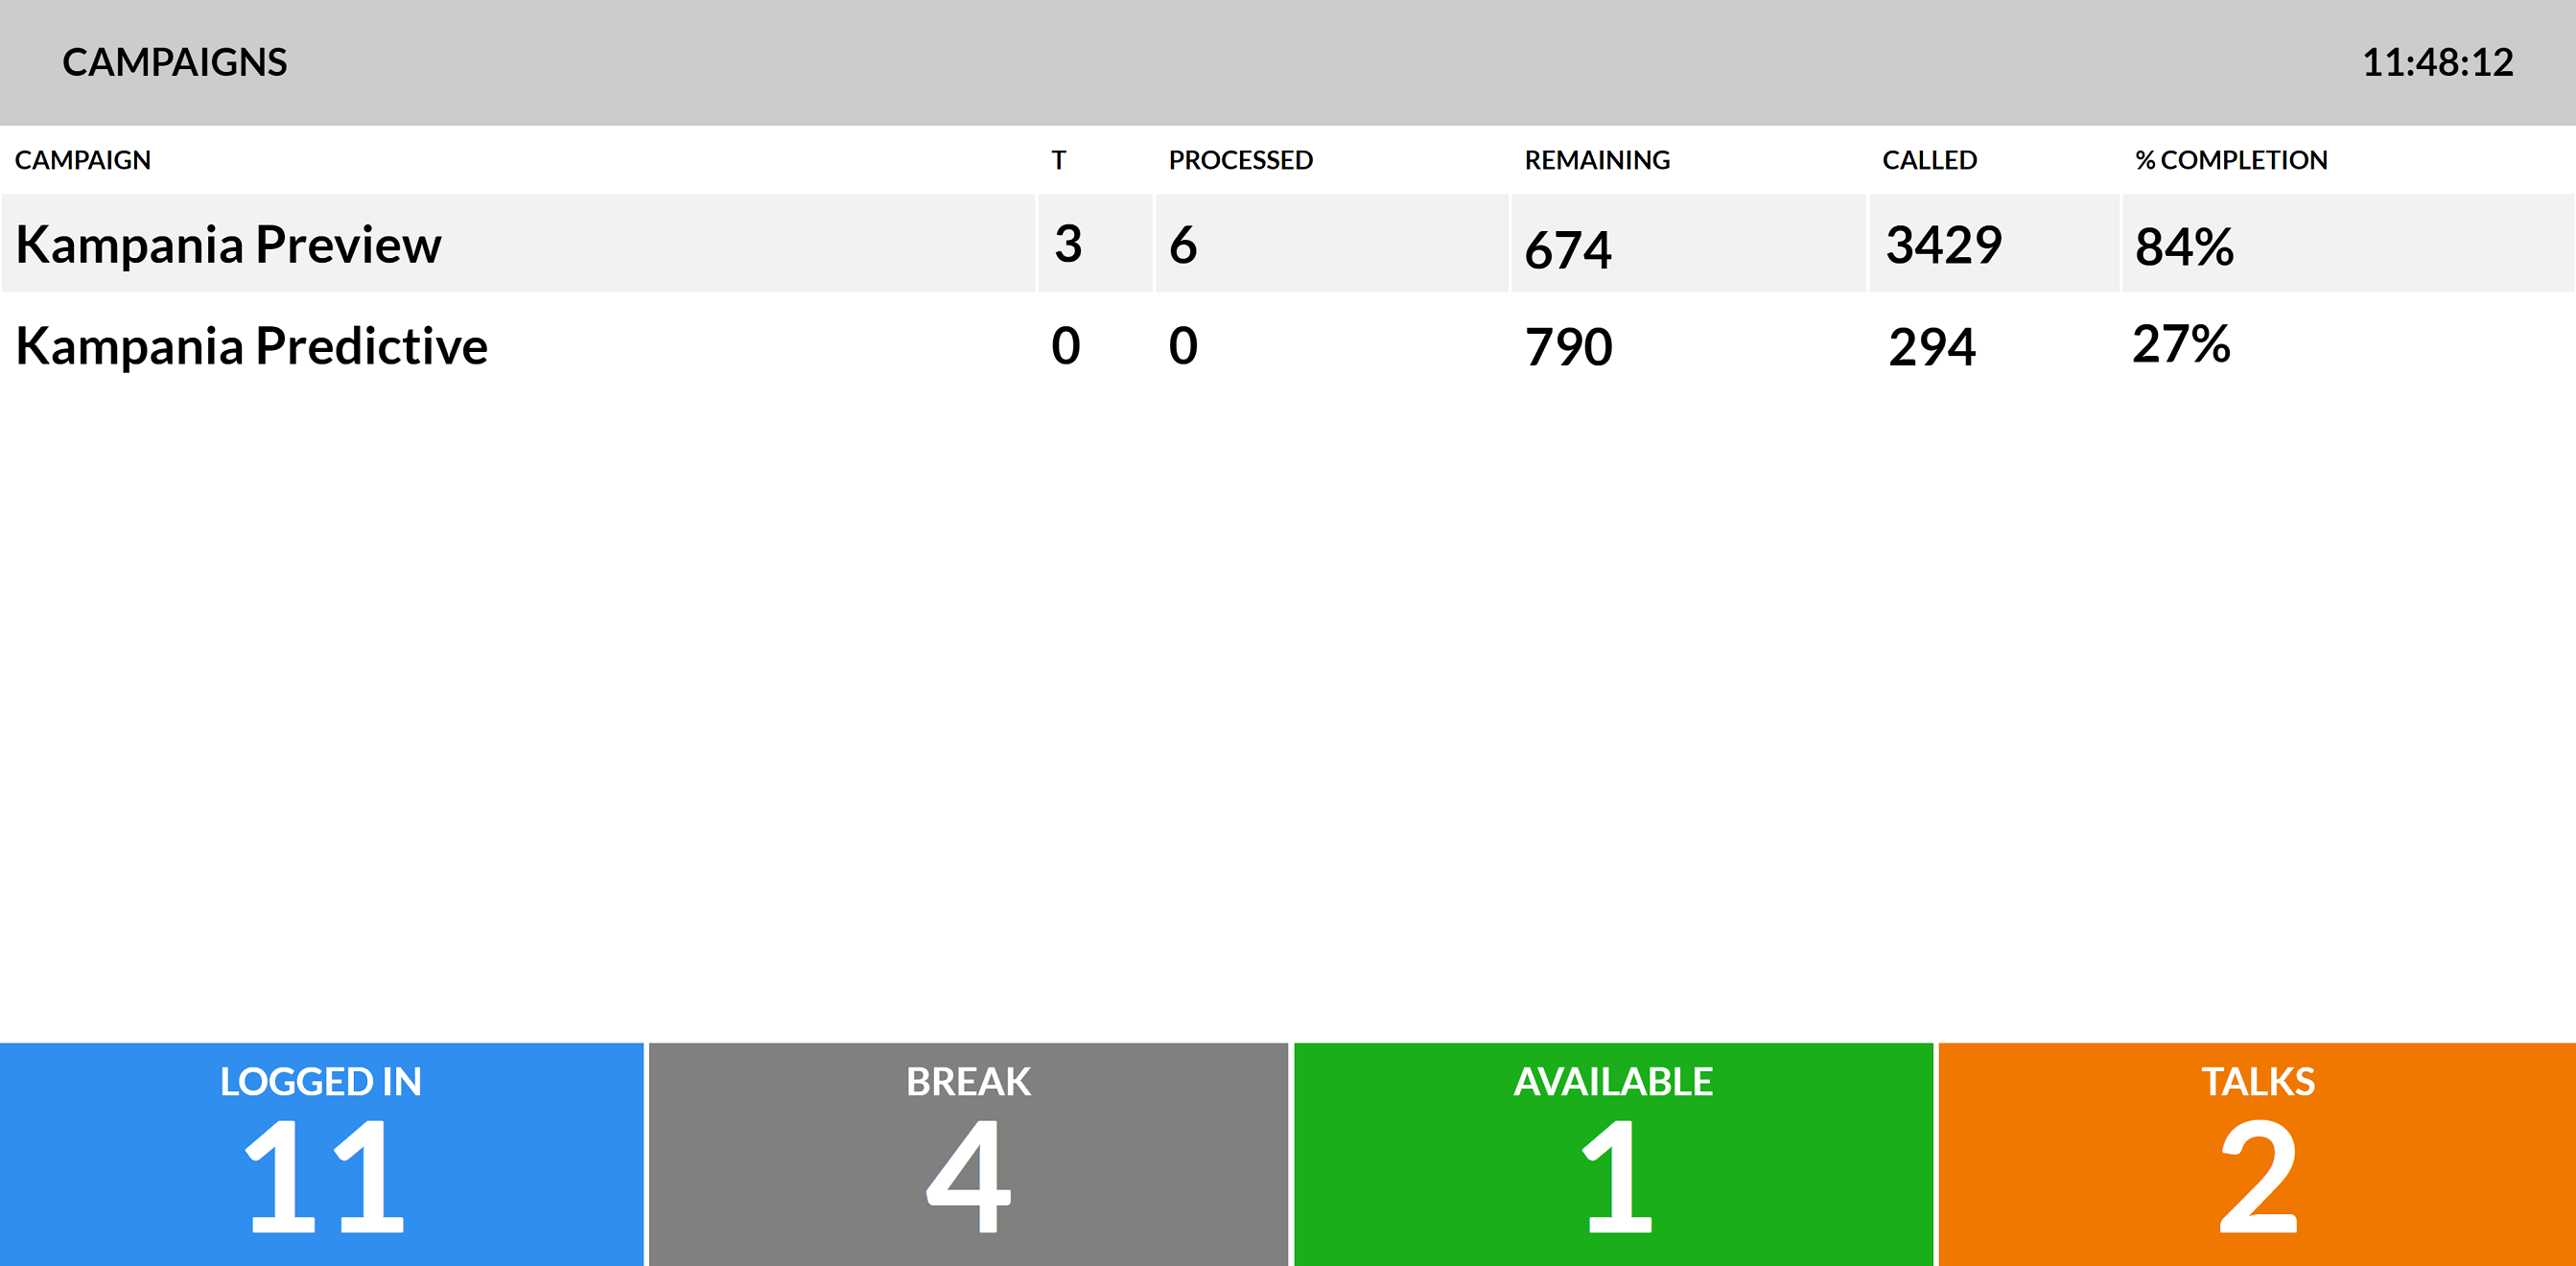
The Campaigns wallboard presents detailed information on the campaigns being carried out.
- Campaign - nazwa kampanii,
- Order - the order of the campaign,
- T - number of people talking at a given time,
- Processed - number of records in processing status (e.g., the status of the record has not been saved),
- Remaining - the number of records left to call,
- Remaining within X h - the number of records that must be called within a certain period of time - records with status My record and Call after date are counted here,
- Called - number of records that have been called,
- % Completion - campaign completion percentage.
Did you know...💡
A campaign appears on the wallboard when it has ringing records. Once it reaches 100%, the campaign ceases to appear on the list.
In addition, tiles appear at the bottom with information on the number of agents logged in, on break, free and currently talking.
Parameters that you can configure
- campaigns for which data is displayed (default - all campaigns),
- possibility to display "Left in" column (default - unchecked),
- time (in hours) from which data will be taken for ringing displayed in the "Left in" column,
- ability to display the "Order" column.
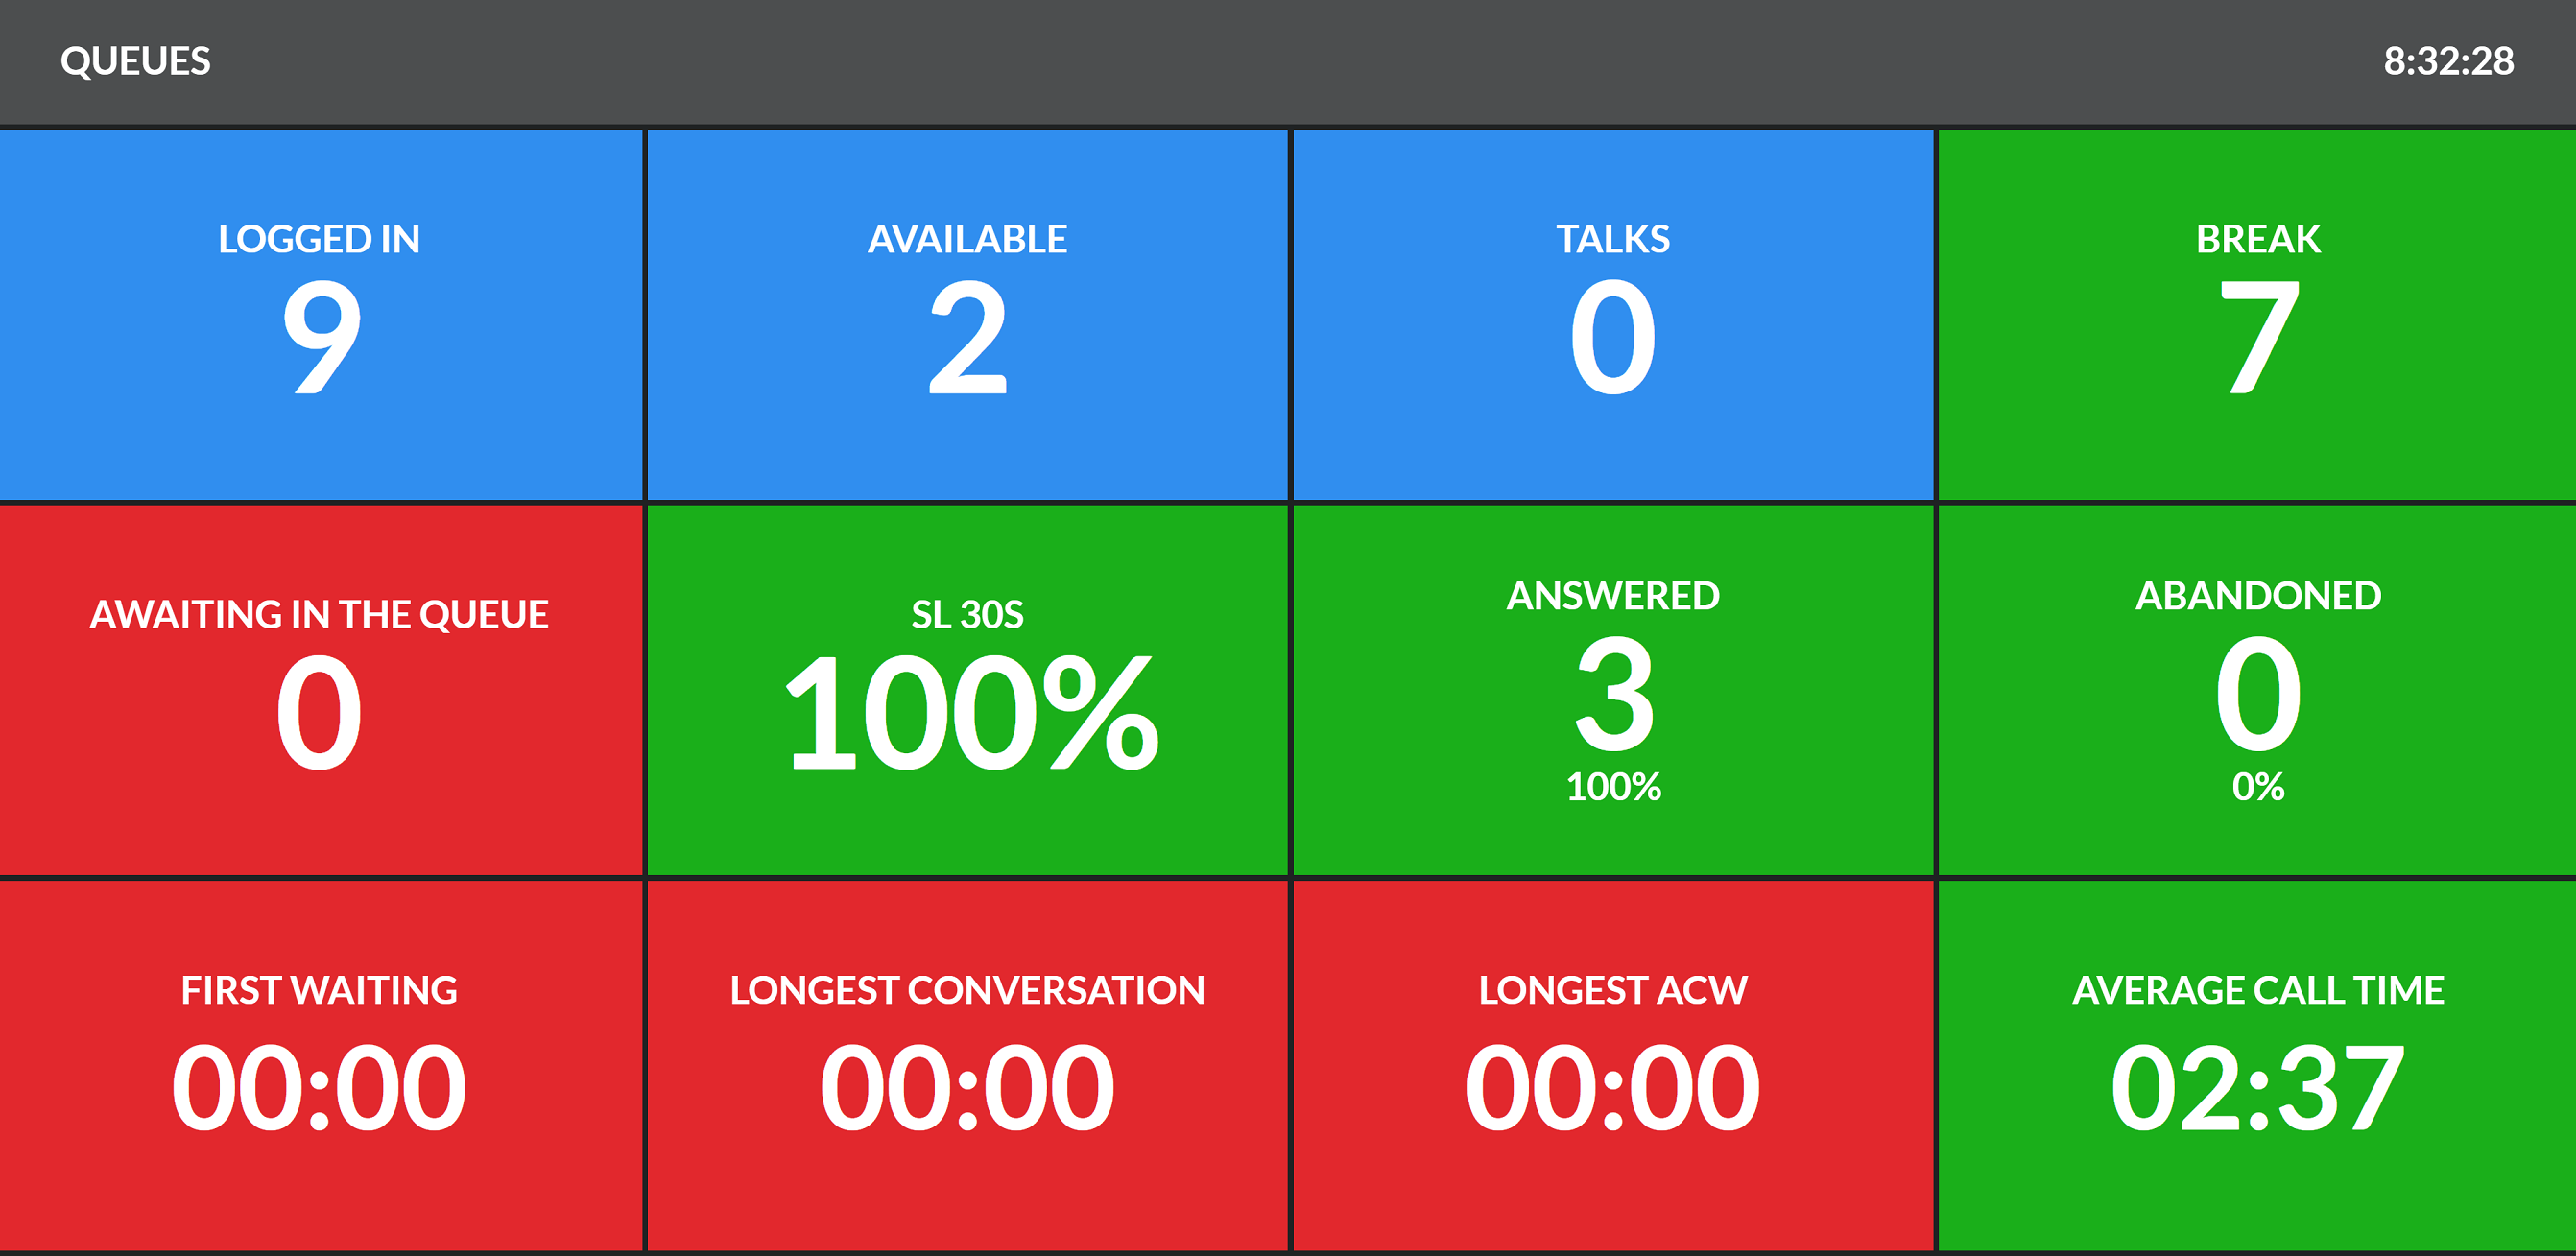
The Queues wallboard shows detailed information about the incoming calls in each queue and the agents handling the calls. You can create any number of such wallboards and display data from other queues on each one.
- Logged in - number of agents currently logged in,
- Available - number of agents on Free status,
- Talks - the number of agents conducting calls,
- Break - number of agents who are on break,
- Awaiting in the queue - number of customers waiting in line to be connected to a free consultant,
- SL 300 - service level of the current day,
- Abandoned - number and percentage of abandoned calls (customer disconnected before the agent answered the call),
- First waiting - waiting time for the first customer in the queue to connect,
- Longest conversation - the longest running conversation of the current talks,
- Longest ACW - the longest running ACW at any given time (wrap-up break - you can configure it in the queue settings),
- Average call time - average talk time of all agents on a given day.
Did you know...💡
Time ACW (After Call Work) is the average time spent on post-call work (e.g., completing customer notes).
Parameters you can configure
- queues for which the data will be displayed (default - all queues),
- pauses that will be counted in the "Break" window (default - all pauses),
- the time that is taken into account for the service level threshold of the queue (default - 300 seconds),
- possibility to show percentage of received and abandoned calls (default - unchecked),
- pause, which is treated as an ACW (default - wrap-up),
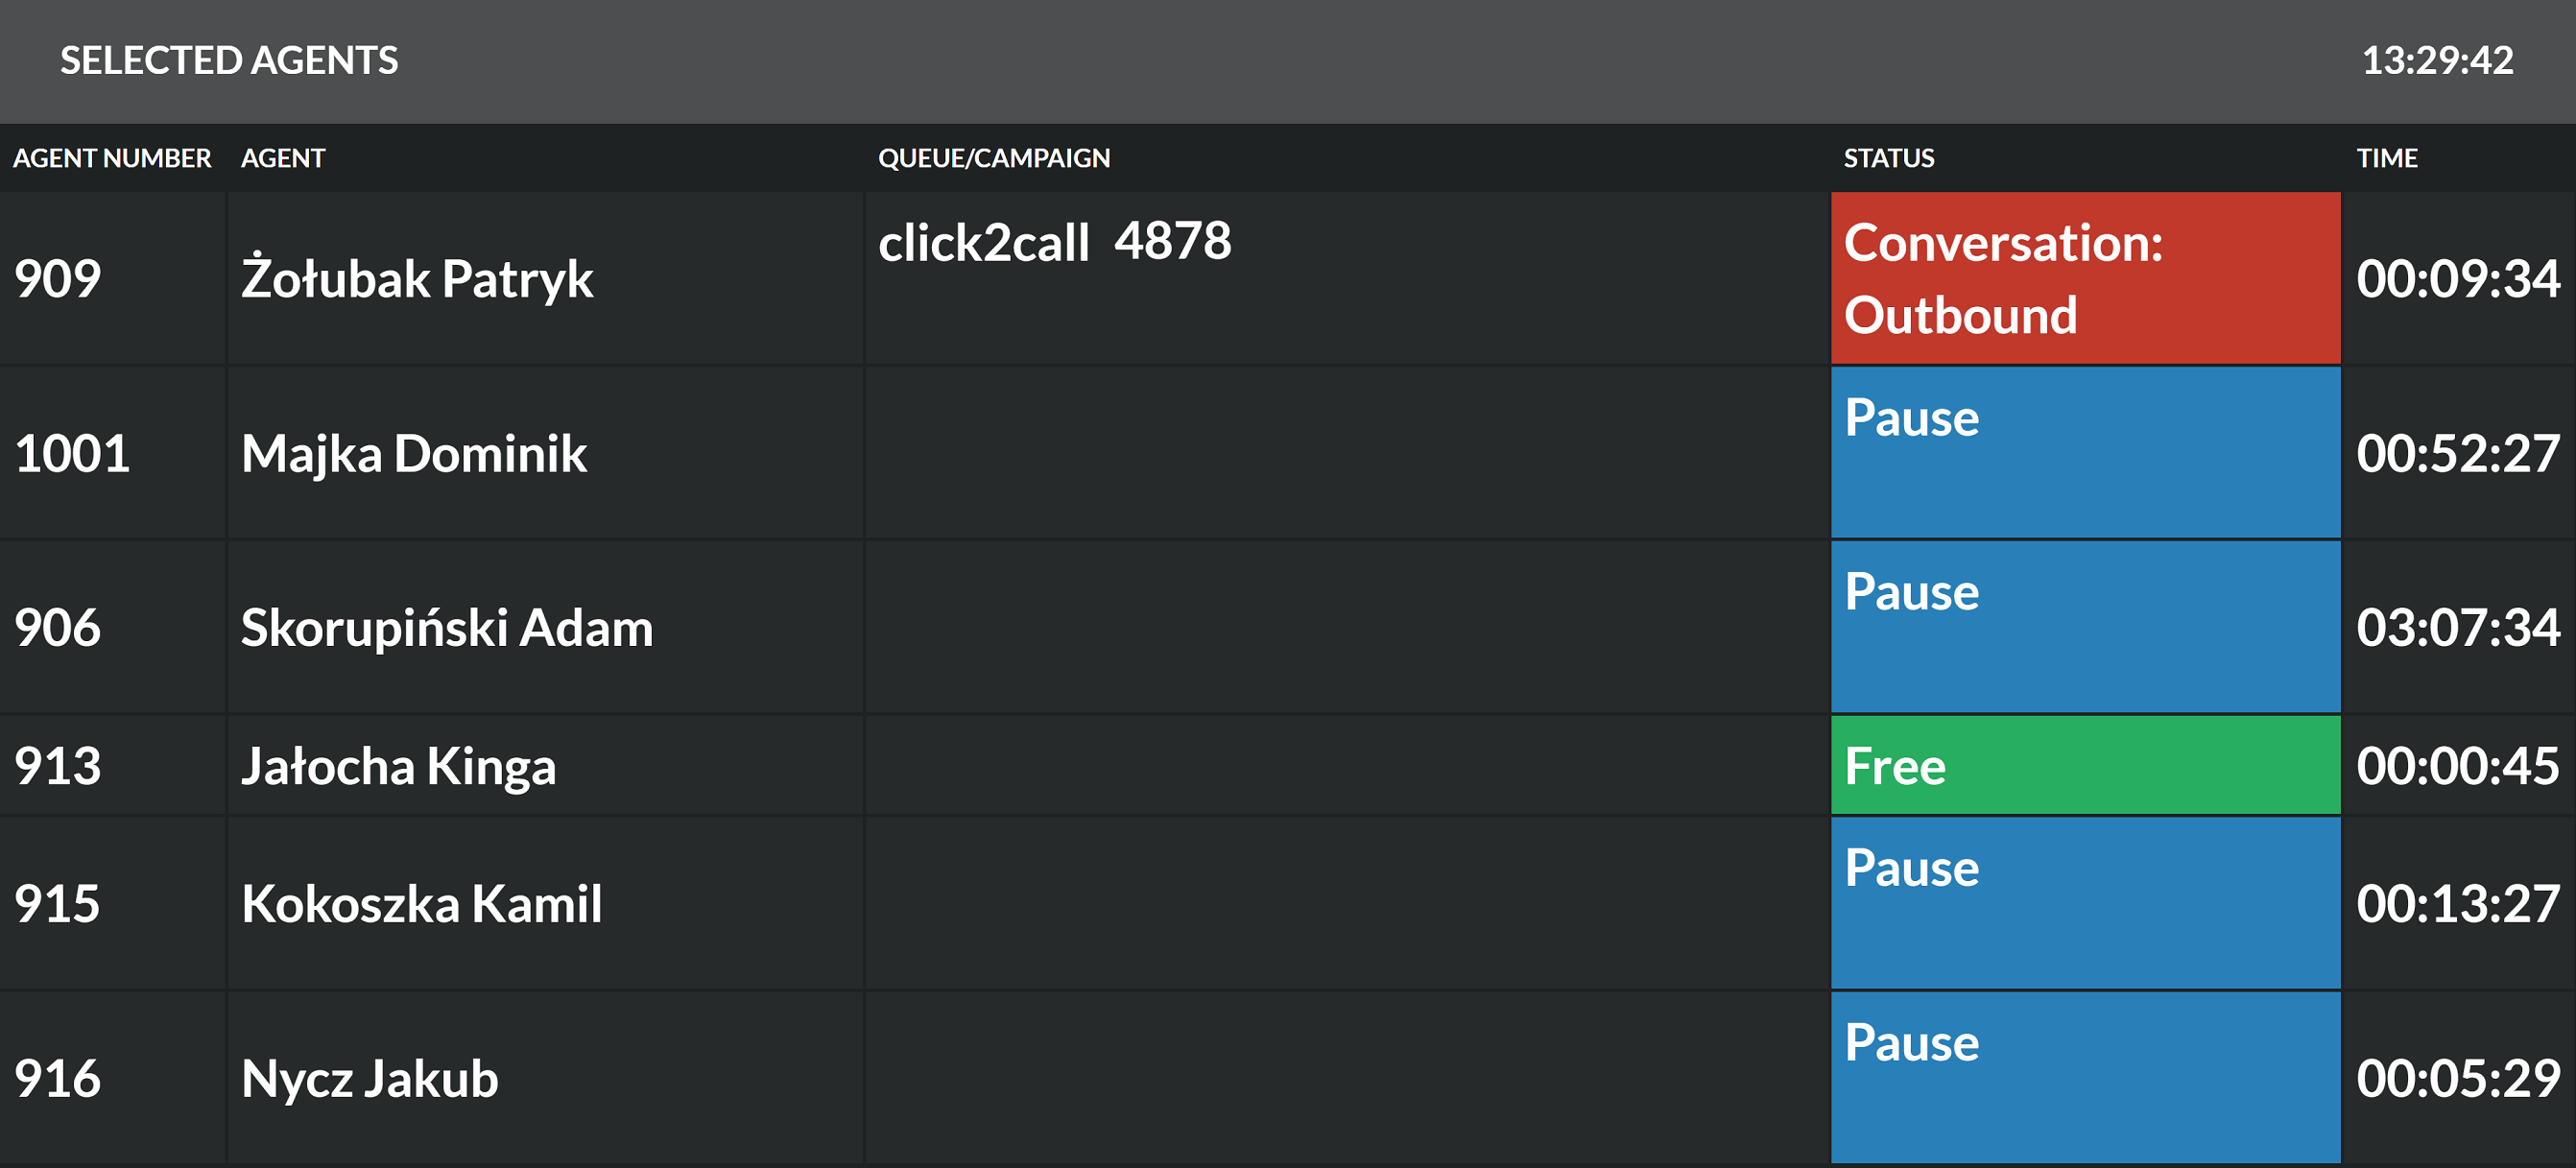
Wallboard Selected agents presents information on the activity of selected agents, e.g. those belonging to one team.
- Agent number - agent internal number,
- Agent - agent's name and surname,
- Queue/Campaign - the name of the queue or campaign to which the agent is assigned,
- Status - agent status: Free/Break,
- Time - the amount of time the agent was on free status or on a break.
Parameters you can configure
- selection of agents to be displayed on the wallboard (all agents are shown by default).
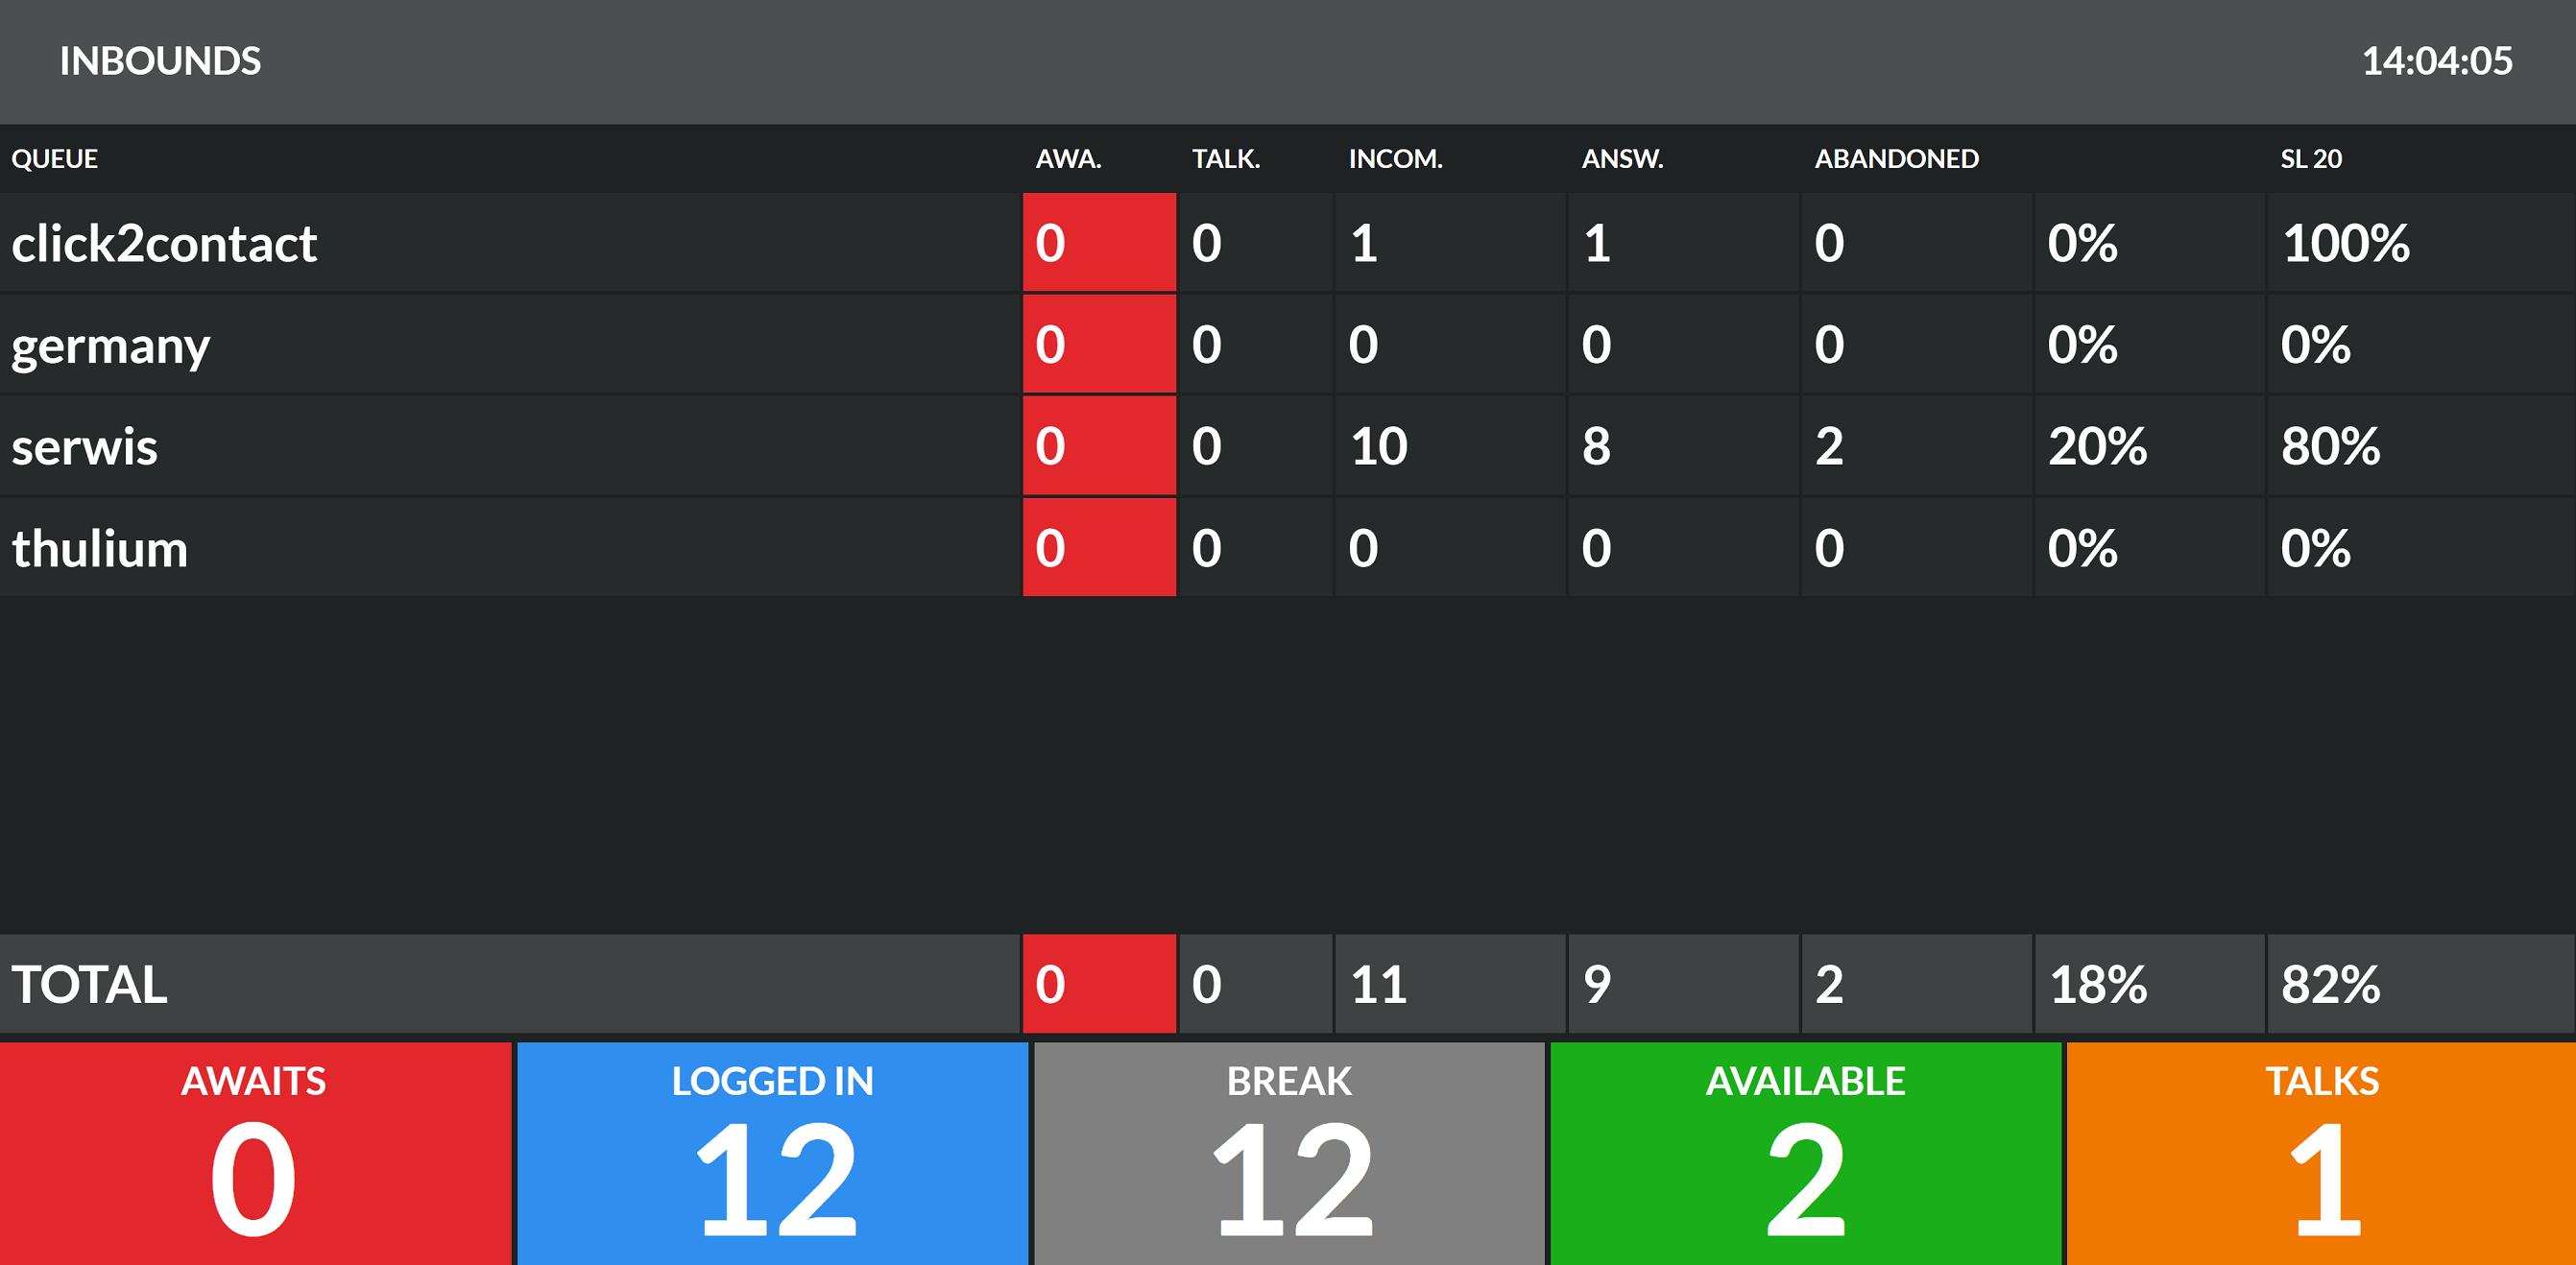
The Inbounds wallboard shows detailed information on incoming calls in each queue.
You can see:
- number of calls waiting,
- number of calls in progress,
- number of incoming calls,
- number of calls answered,
- number and percentage of abandoned calls (the customer hung up before the agent answered the call),
- service level SL 20 (ratio of the number of calls answered before 20 seconds to the number of incoming calls).
In addition, tiles appear at the bottom with information about the number of agents logged in, on break, free and currently talking.
Parameters you can configure
- queues for which data is displayed (default - all queues),
- pauses that are taken into account in the "Break" window,
- groups of agents for which statistics will be presented,
- time from which data are presented on the wallboard (default - 1 hour),
- the time that is taken into account for the service level threshold of the queue (default - 20 seconds).
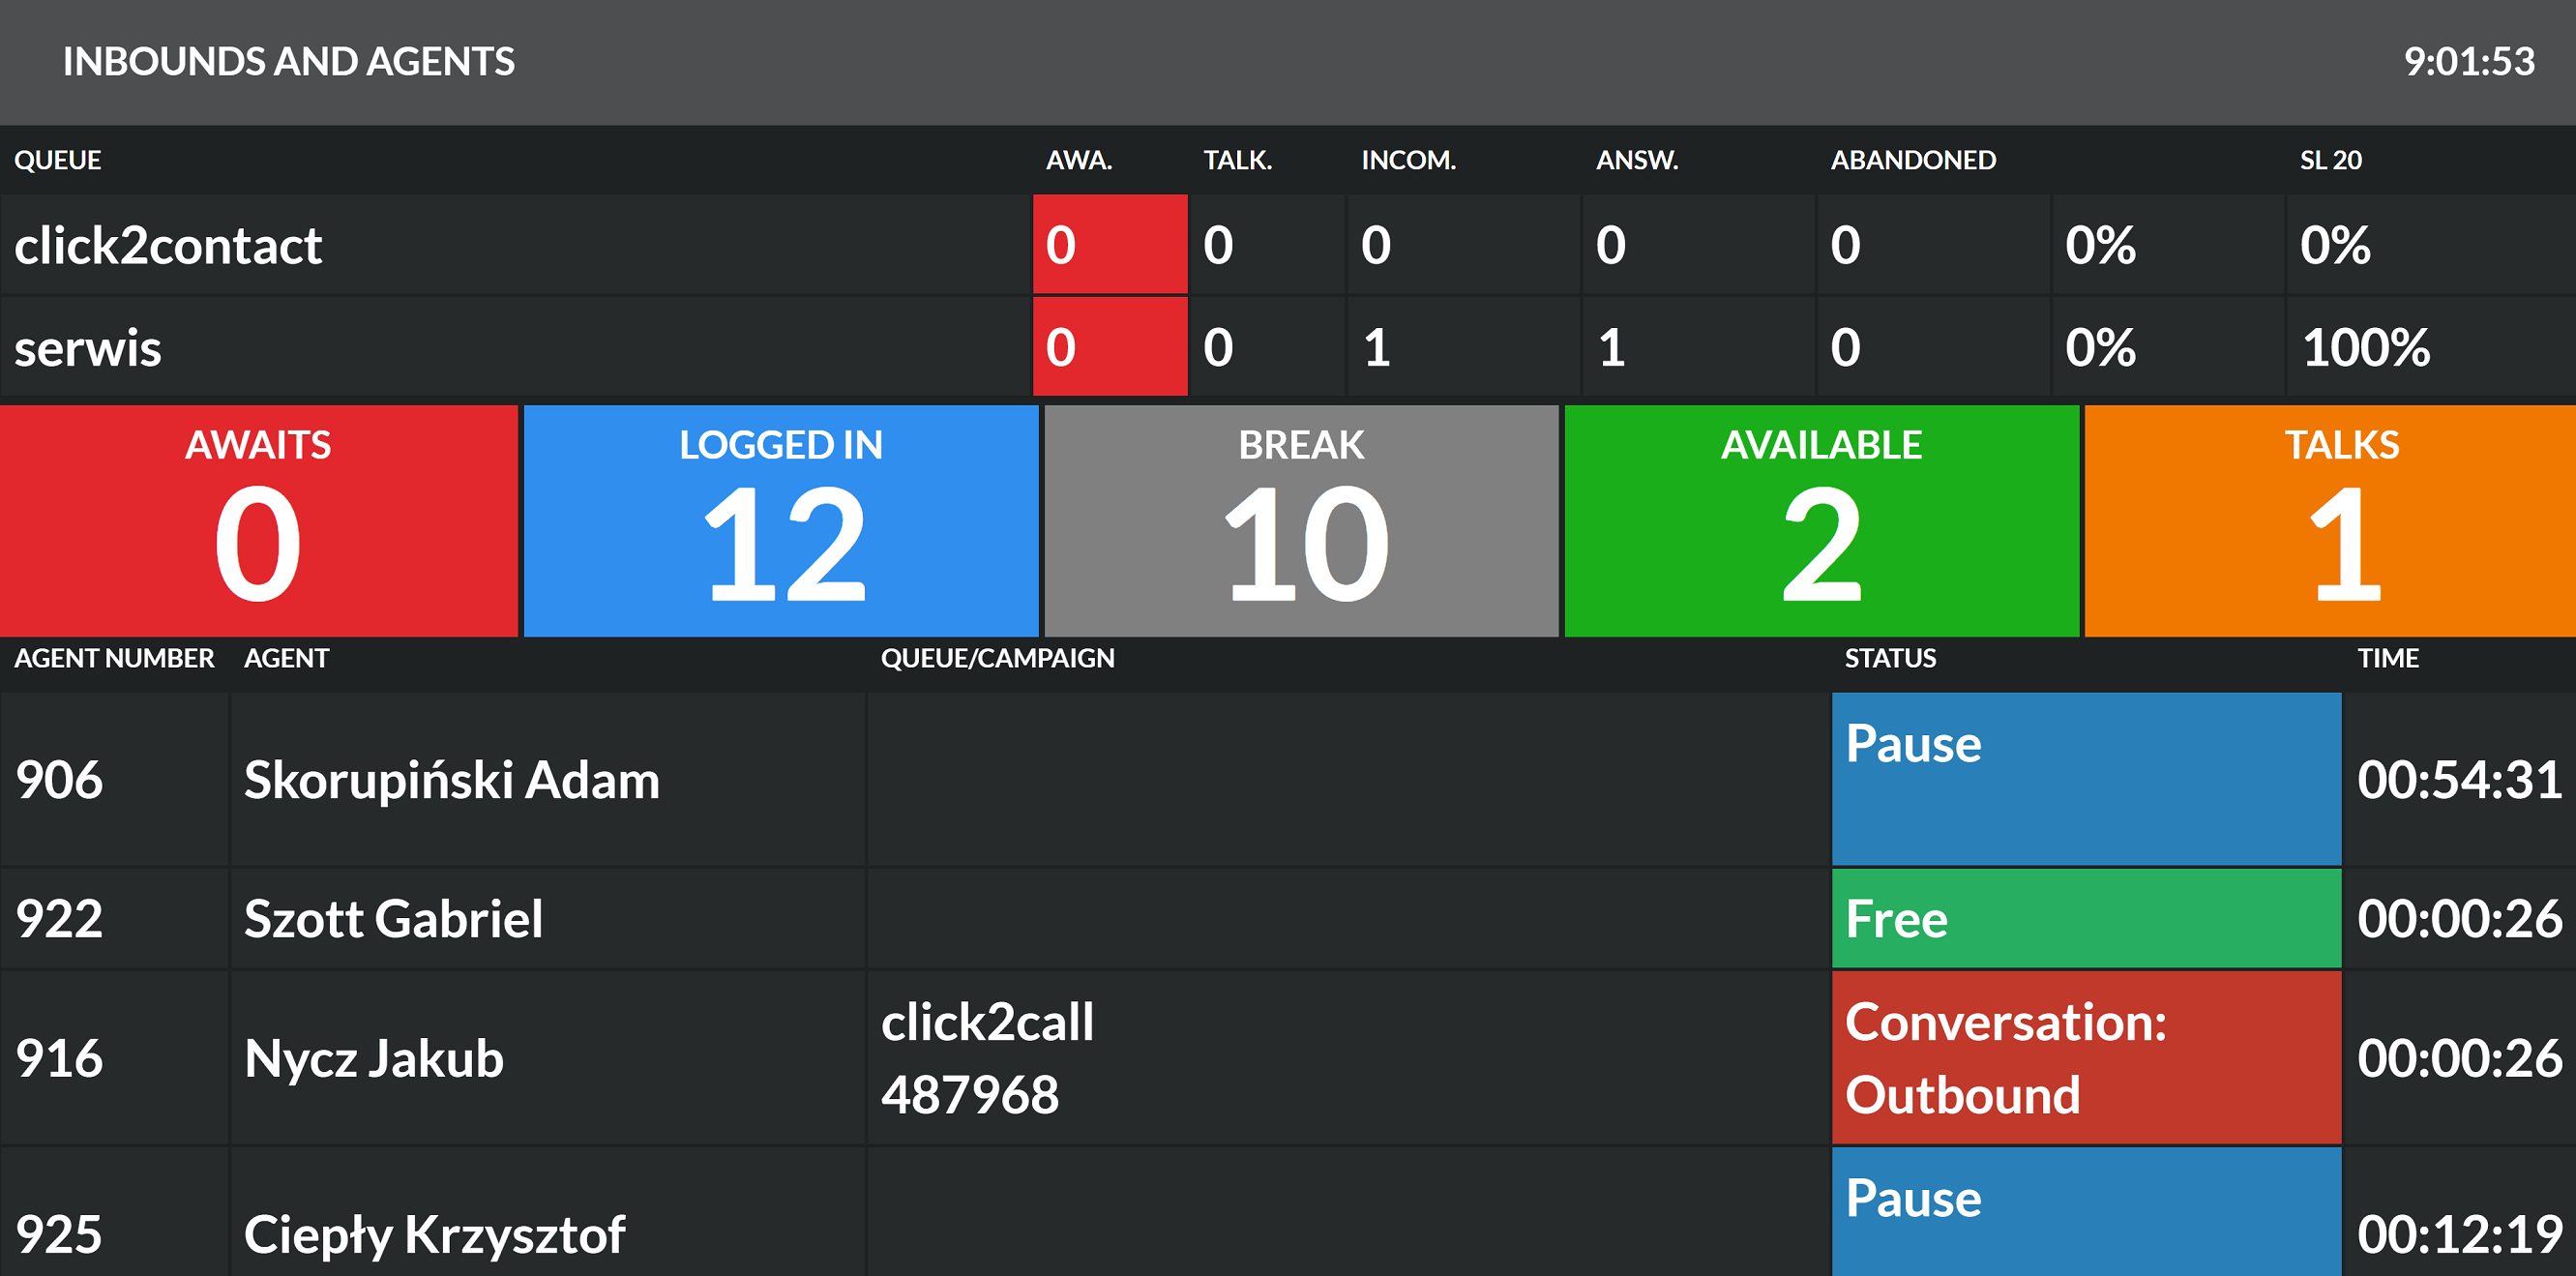
The Inbounds and agents wallboard shows detailed information on incoming calls and agent activity per queue.
Data includes:
- number of waiting calls,
- number of conversations held,
- number of incoming calls,
- number of calls received,
- number and percentage of abandoned calls (the customer disconnected before the agent answered the call),
- service level SL 20 (ratio of calls answered before 20 seconds to incoming calls),
- agent internal number,
- agent's name,
- name of the queue or campaign within which the conversation is conducted,
- agent status: Free/Break,
- amount of time the agent was on free status or on a break.
In addition, tiles with information about the number of agents logged in, on break, free and currently talking are placed in the center.
Parameters you can configure
- color theme of the displayed wallboard (default - light),
- queues for which data is displayed (default - all queues),
- time that is taken into account for the service level threshold of the queue (default - 20 seconds),
- time from which data are presented on the wallboard (default - 1 hour).
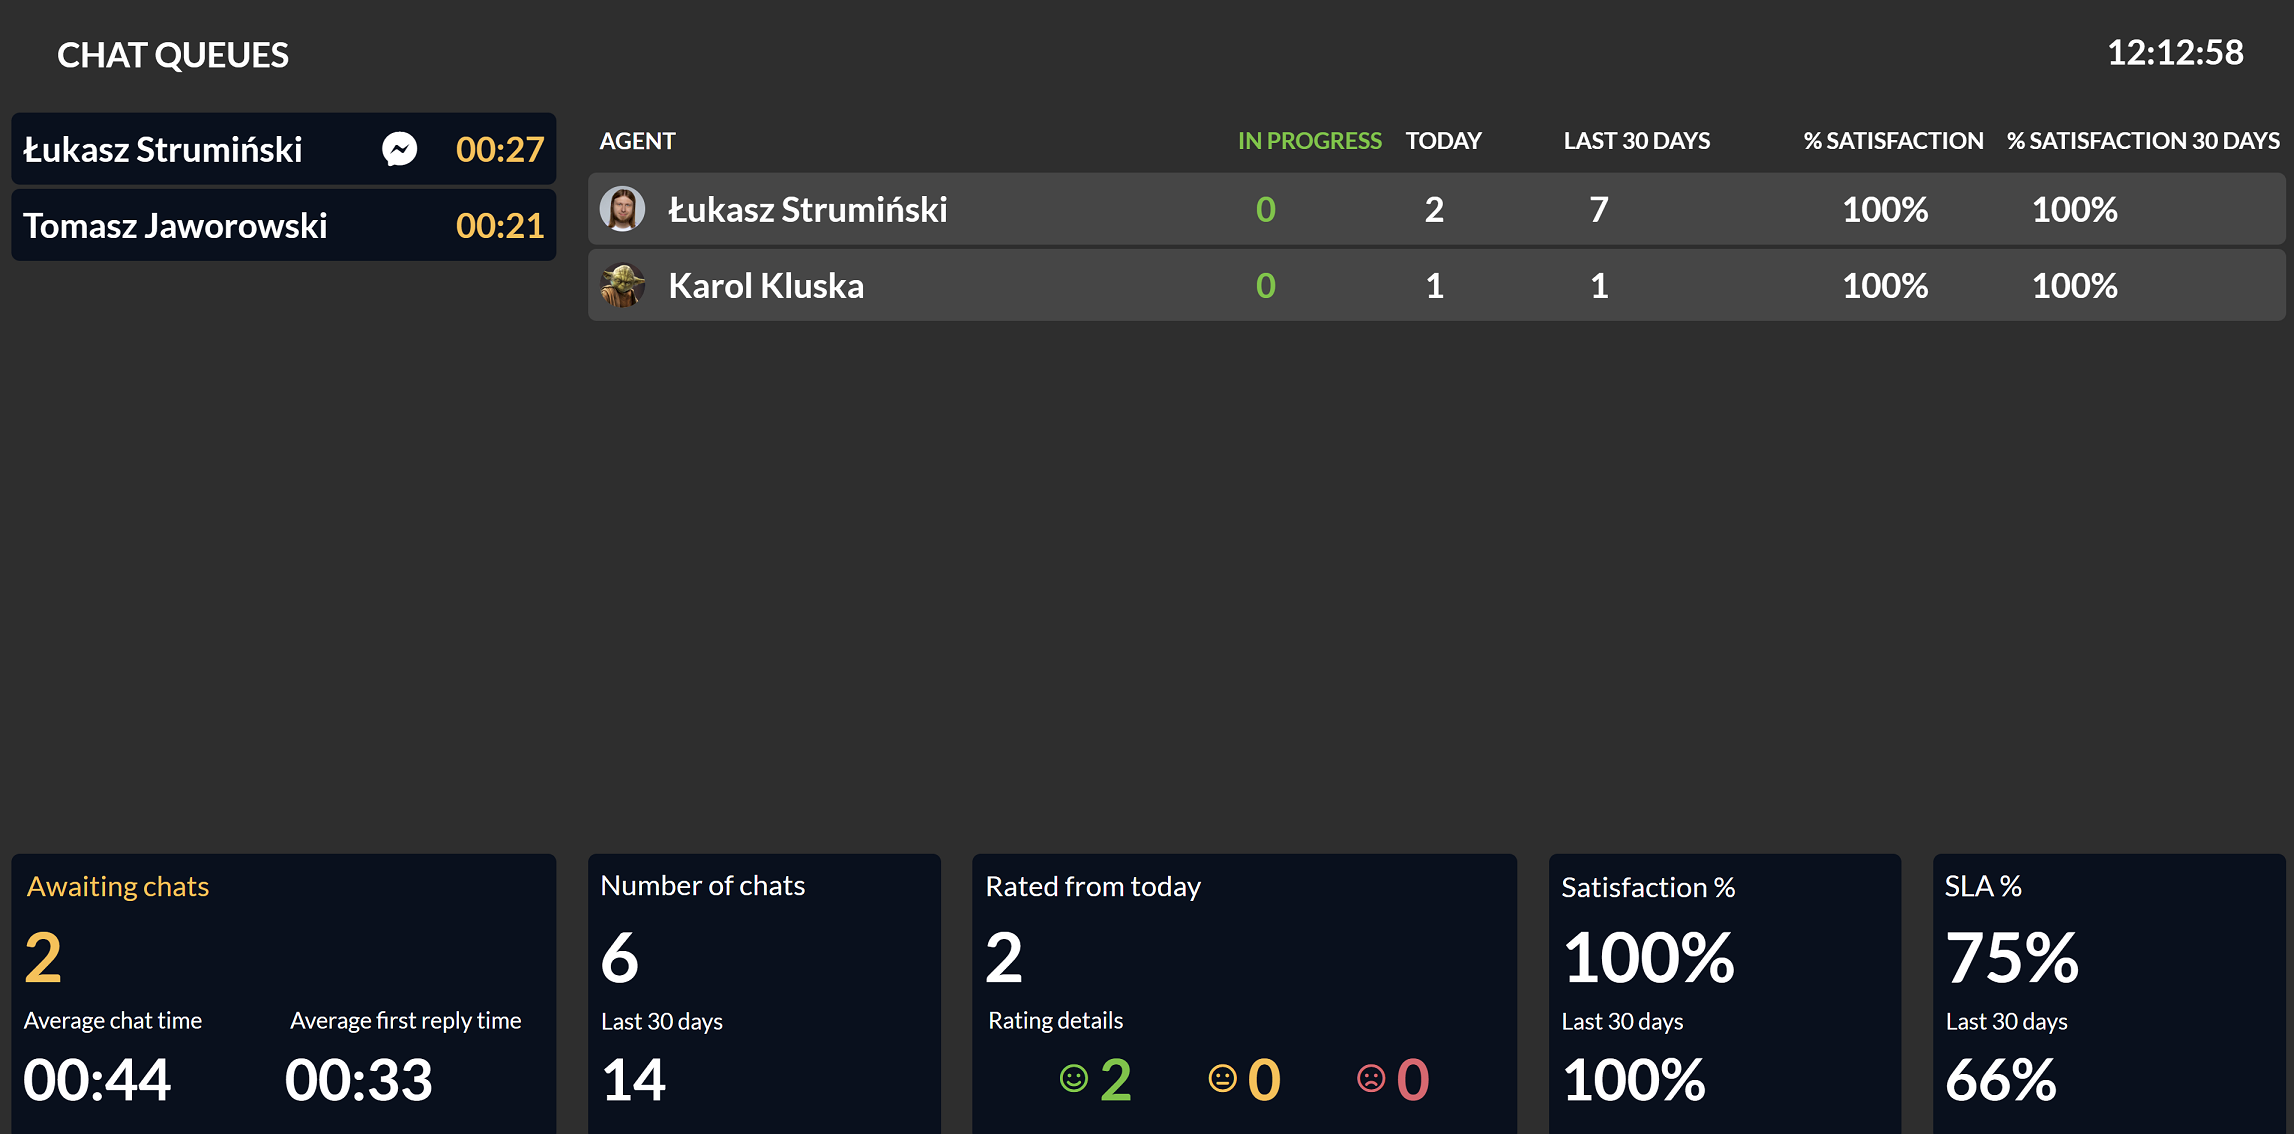
The Chat queues wallboard presents detailed information regarding pending chats to be served and key indicators relative to agents and the queue.
Data includes:
- list of chats queued for service,
- number of chats queued for service,
- average time of chats forwarded to agents,
- average response time to chat by agents,
- list of agents handling chats from the queue in the last 30 days,
- number of chats currently supported by a given agent,
- number of chats served today by a given agent,
- number of chats served over the last 30 days by a given agent,
- % satisfaction of chatters from today of a given agent,
- % of chat satisfaction of the last 30 days of a given agent,
- number of chats in the queue (passed on to be handled by agents),
- number of chats in the queue for the last 30 days (forwarded to be handled by agents),
- number of chat ratings submitted to agents,
- % of chat satisfaction from today for the queue,
- % satisfaction of chatters over the last 30 days for the queue,
- % SLA for the established first response time target of today,
- % SLA for the established first response time target from the last 30 days.
Parameters you can configure
- theme color of the displayed wallboard (default - light),
- queues for which data is displayed (default - all queues),
- time that is taken into account for the queue SLA threshold (default - 20 seconds).
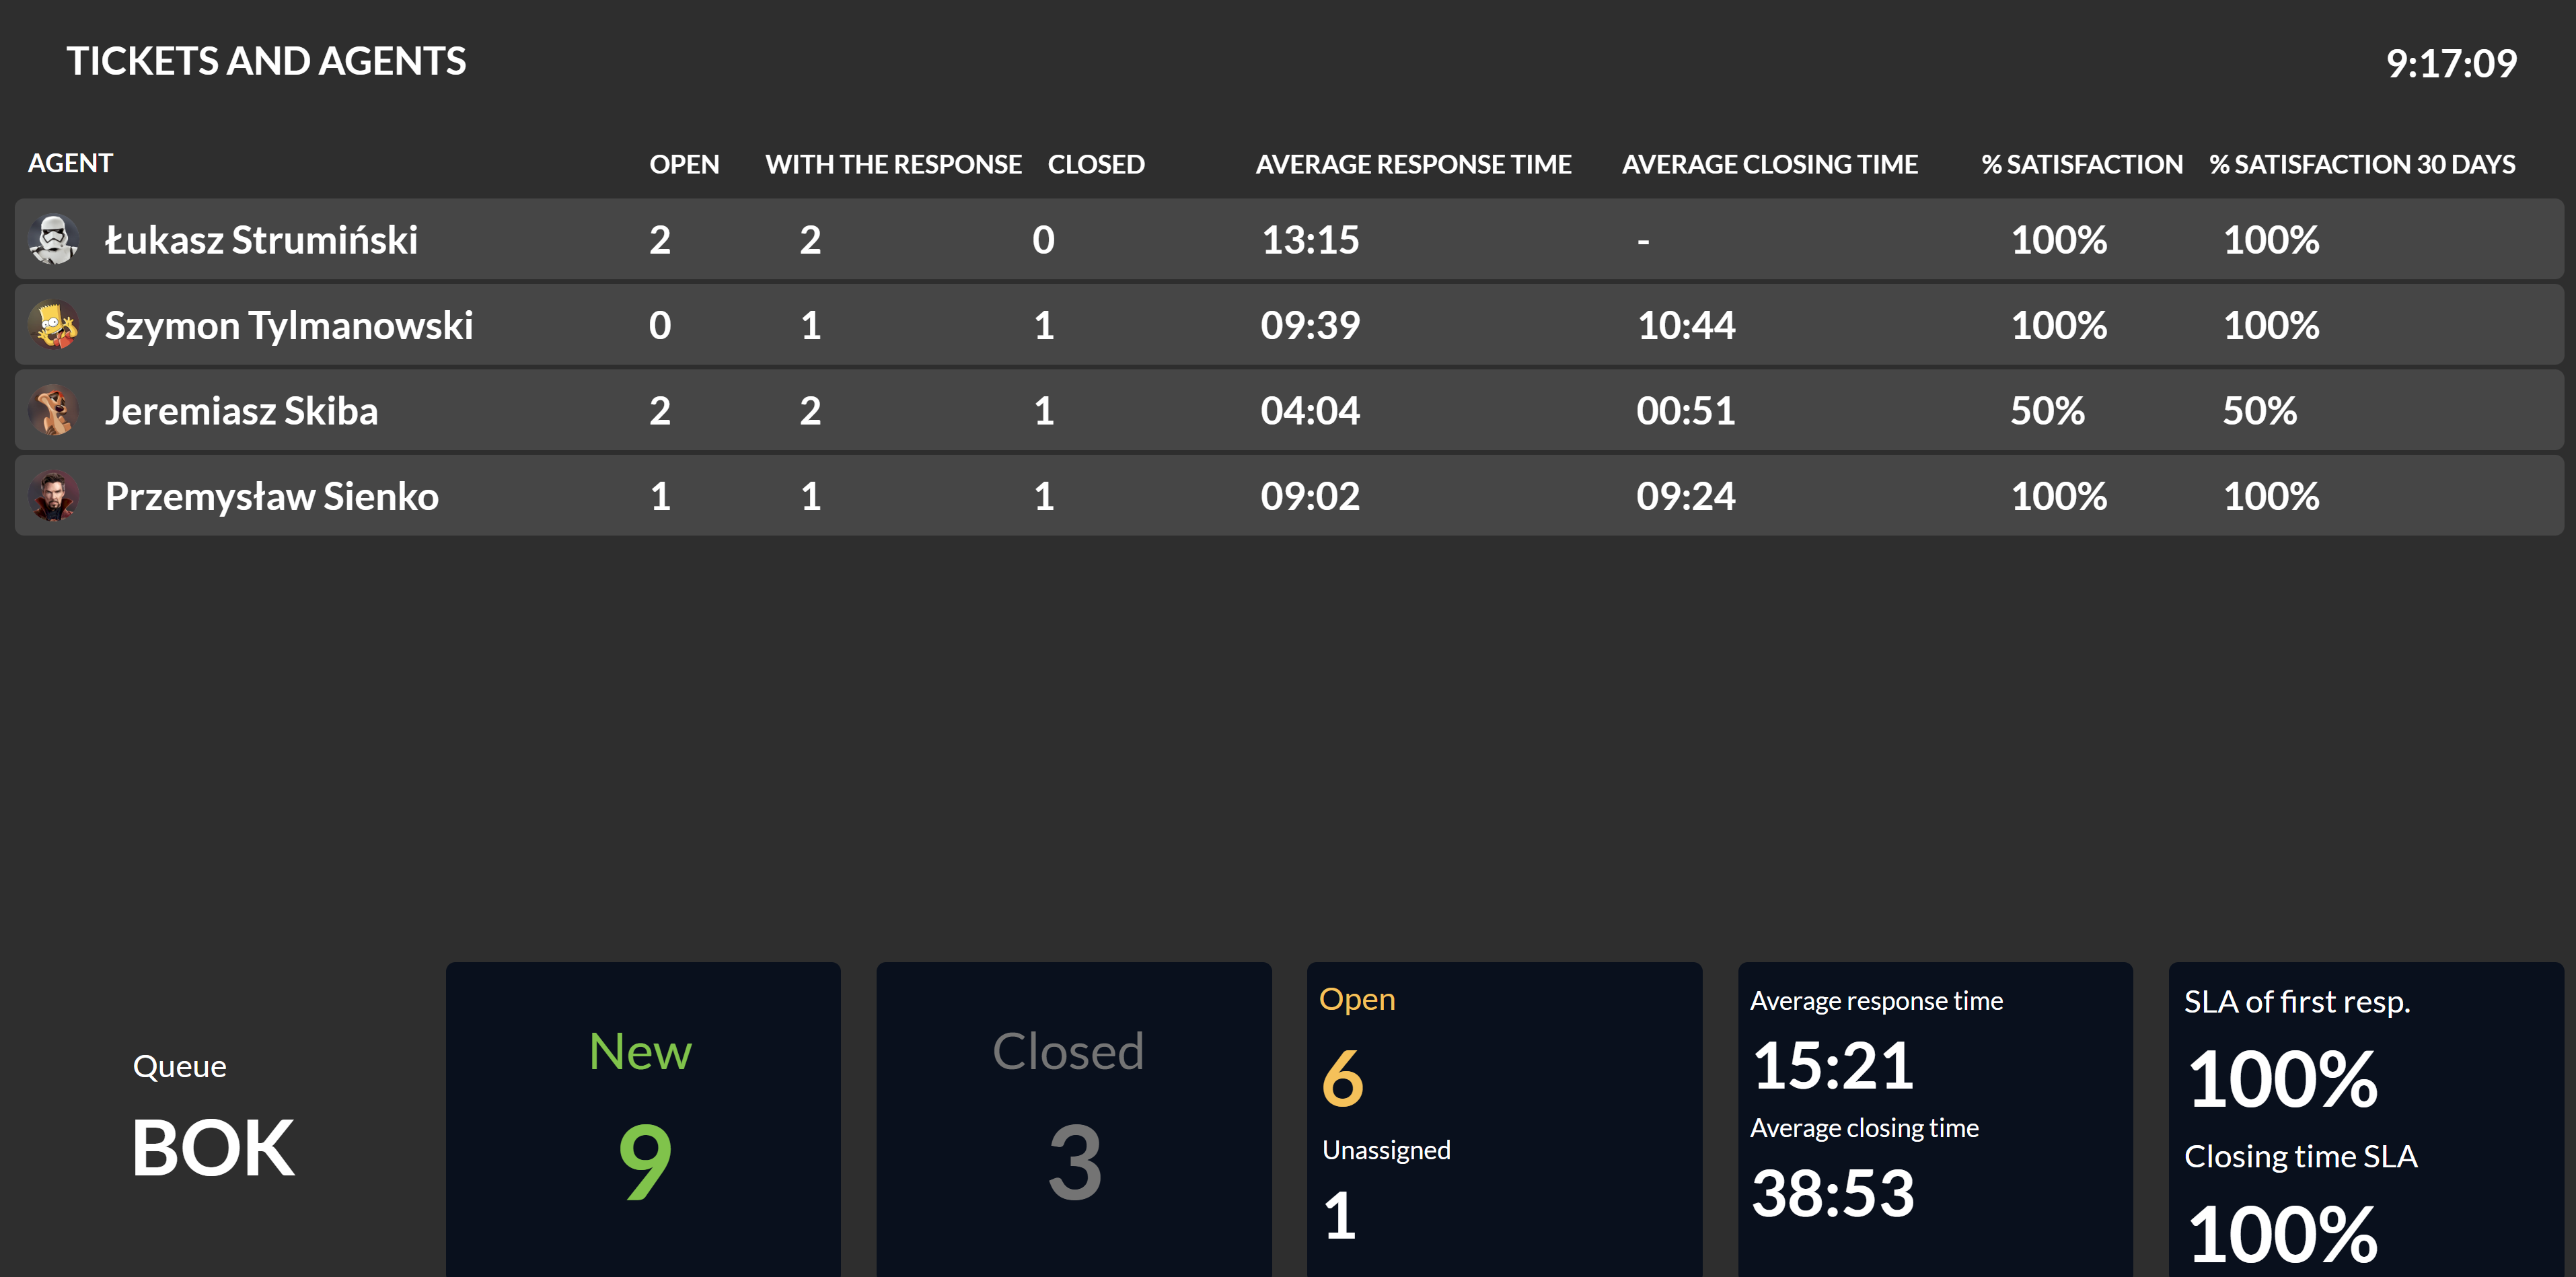
The Tickets and agents wallboard shows detailed information regarding the number of tickets handled by agents and the indicators associated with the selected queue.
Data includes:
- number of currently open tickets assigned to a given agent,
- number of tickets in which the first response was given today for the assigned agent,
- number of tickets closed today (first closing) against the assigned agent,
- average time of the first response in a ticket assigned to a given agent,
- average time of the first closing of the ticket, where the agent is assigned,
- % satisfaction of the day's tickets of a given agent,
- % satisfaction of tickets over the last 30 days of a given agent,
- number of new tickets in the queue (created today),
- number of today's closed tickets in the queue (first closing),
- number of open tickets in the queue,
- number of unassigned tickets in the queue,
- average time of the first answer given today in the queue,
- average time of the first closure performed today in the queue,
- % SLA for the established first response time target of today,
- % SLA for the established first-close time target from today's date.
Important...⚠️
Wallboard takes into account tickets from the last 90 days.
Parameters you can configure:
- theme color of the displayed wallboard (default - light),
- queues for which data is displayed (default - all queues),
- time that is taken into account for the SLA threshold of the queue response (default - 120 minutes),
- time that is taken into account for the SLA threshold for closure in the queue (default - 240 minutes).
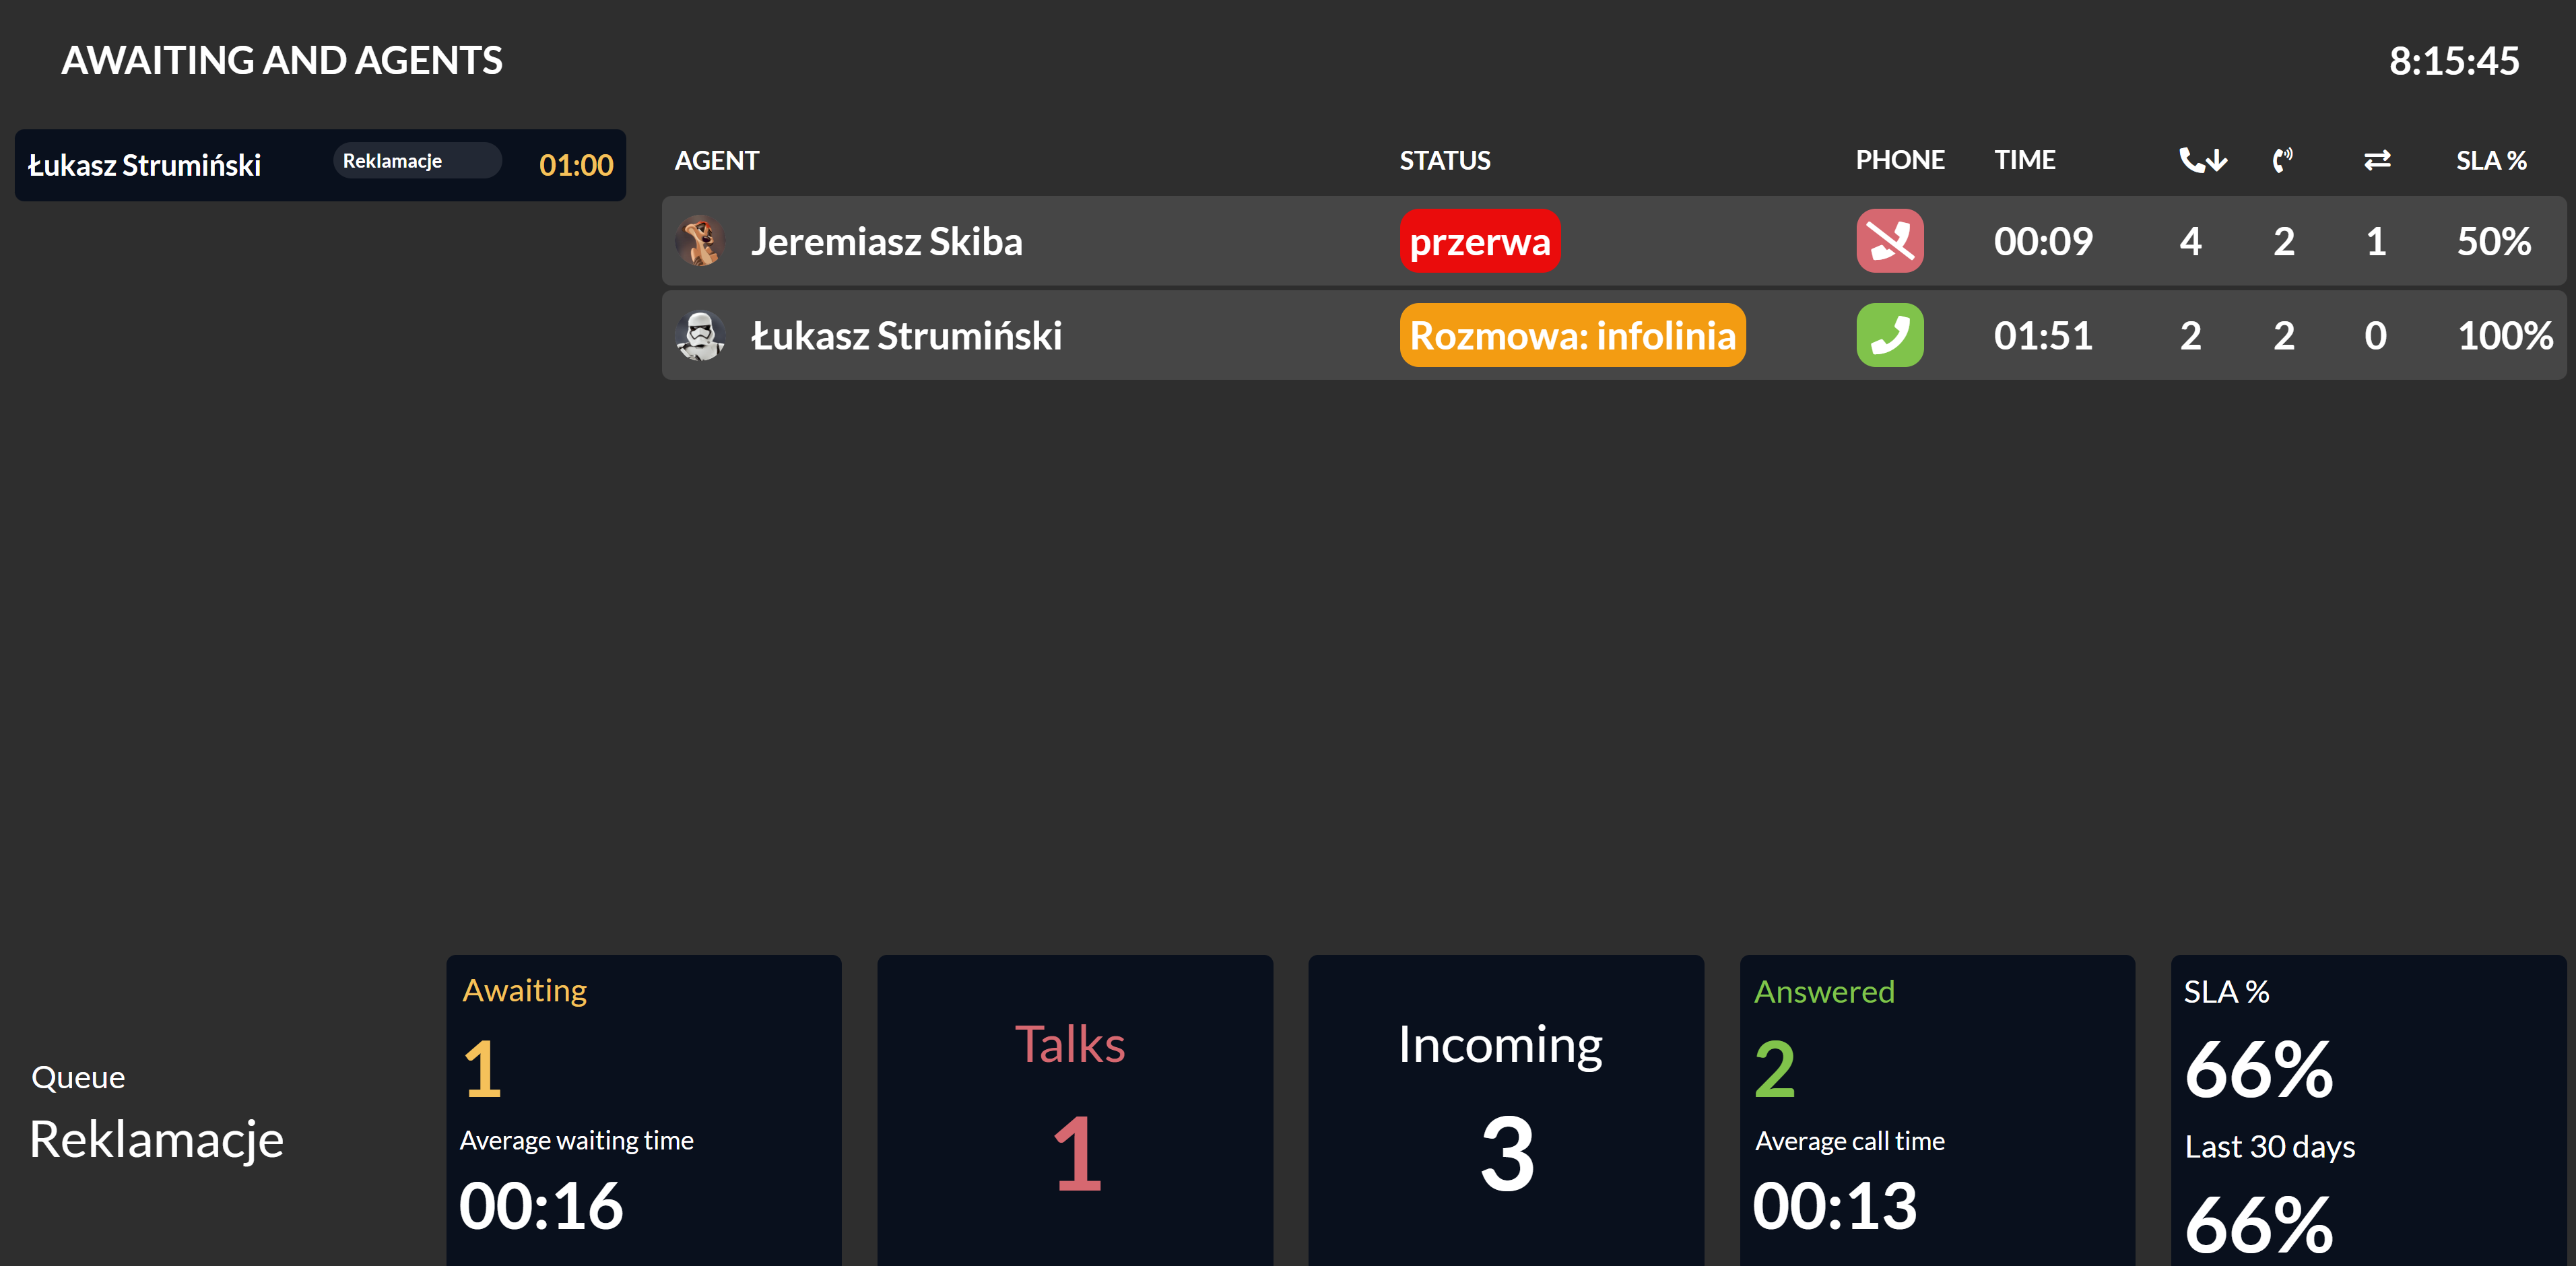
Wallboard Awaiting and agents compiles a list of pending calls in given queues and a list of logged-in agents handling them. In addition, indicators related to the handling of these queues are collected.
Data include:
- waiting time of a particular call in a given queue before it is answered,
- list of currently logged-in agents for service in a given queue,
- current status of the logged-in agent,
- information whether the agent has a phone running,
- time spent on a given status (since the last change),
- number of calls today offered to a given agent
 ,
, - number of calls today handled by a given agent
 ,
, - number of transfers today made by a particular agent
 ,
, - % SLA of call answerability of a given agent today,
- number of calls currently waiting in a given queue,
- average waiting time of all connections for the queue (including those abandoned) today,
- number of conversations currently in progress in a given queue,
- number of calls coming into the queue today,
- number of connections served today in a given queue,
- average time of calls made today in the queue,
- % SLA of call answering per queue today,
- % SLA of call answering per queue in the last 30 days.
Parameters you can configure:
- theme color of the displayed wallboard (default - light),
- queues for which data is displayed (default - all queues).
Did you know...💡
Pause colors can be set in the module Pauses.

Share your opinion with us