Insights

Author: Łukasz Strumiński
Created: 2023-11-28. Updated: 2023-11-28.
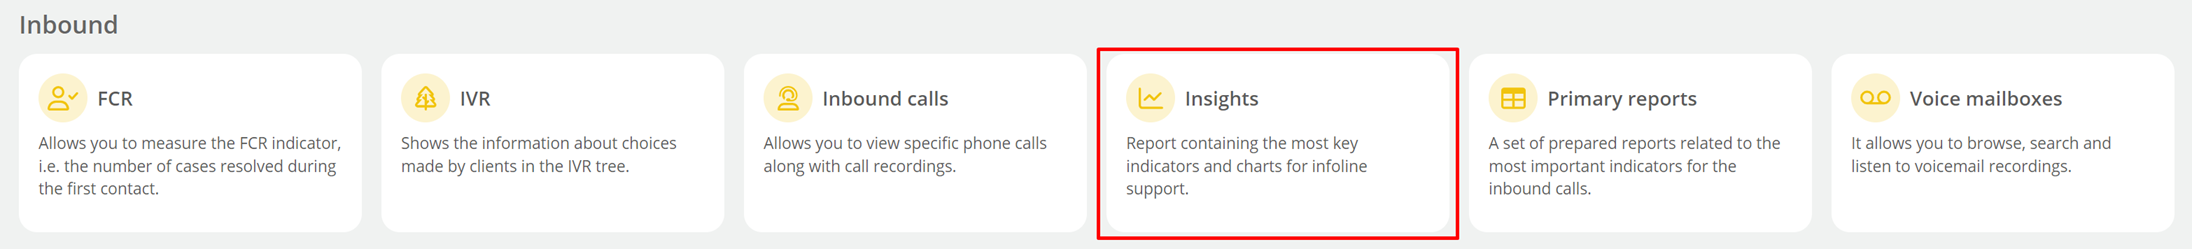
The Insights report provides a comprehensive analysis of key indicators related to Infoline operations. Insights examines work methodologies for inbound telephone traffic and allows conclusions to be drawn to improve Hotline operations. One of the unique advantages of this solution is the ability to study trends in comparison with the same previous period. To use this report, go to Reports → Inbound → Insights.
If you need to select a specific queue or queues, click on  .
.
Insights by default displays analytical data from the last 7 days, to change the time examined, click on the  .
.
Hint...🔎
The Insights report displays information for a maximum time period of 31 days. Call times in this report are calculated to the nearest millisecond.
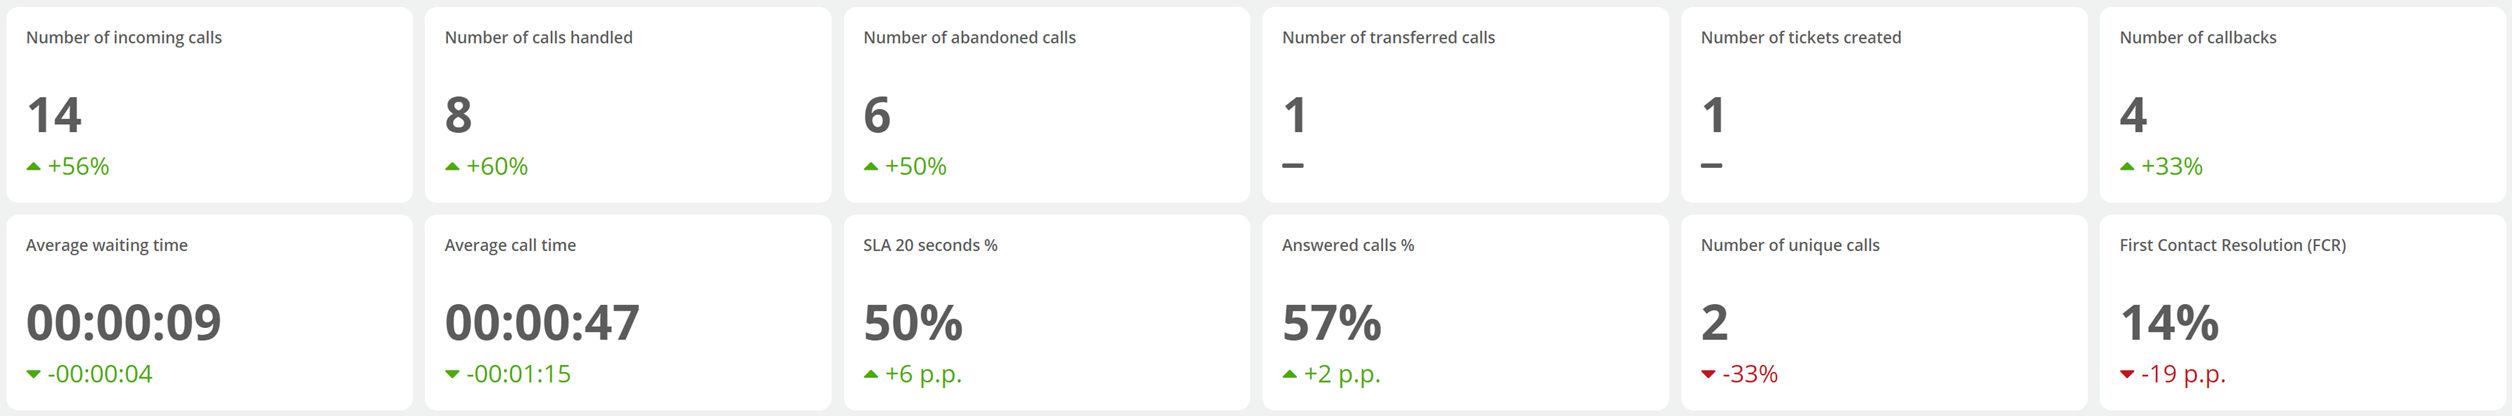
- Number of incoming calls - number of all calls that went into the queue,
- Number of calls handled - calls that were answered by Agents,
- Number of abandoned calls - calls that were disconnected by customers before being answered by the Agent,
- Number of transferred calls - number of calls that were transferred to another Agent or to another queue,
- Number of tickets created - tickets that were created as part of a phone call,
- Number of callbacks - number of callbacks made within the Infoline queue,
- Average waiting time - average waiting time for an Agent to answer a call,
- Average call time - average duration of a conversation between a Customer and an Agent,
- SLA 20 seconds % - ratio of calls answered before 20 seconds to incoming calls,
- Answered calls % - determines what percentage of incoming calls are calls answered by Agents,
- Number of unique calls - number of incoming calls from different phone numbers,
- First Contact Resolution (FCR) - ratio of unique calls to incoming calls.
Did you know...💡
First Contact Resolution is a parameter that determines the % of cases that were resolved during the first contact with a Consultant. It is considered one of the most important indicators for Contact Center.
For the above indicators there are visible trends, in the case of a value of "-" it means a decrease in such relative to the preceding period. If the indicator is with a "+" sign, the current value of the indicator is higher by a given value compared to the same preceding period. Trends for the number of tickets are expressed in percentage, for times in hours; and for SLA, FCR and Answered calls in percentage points.
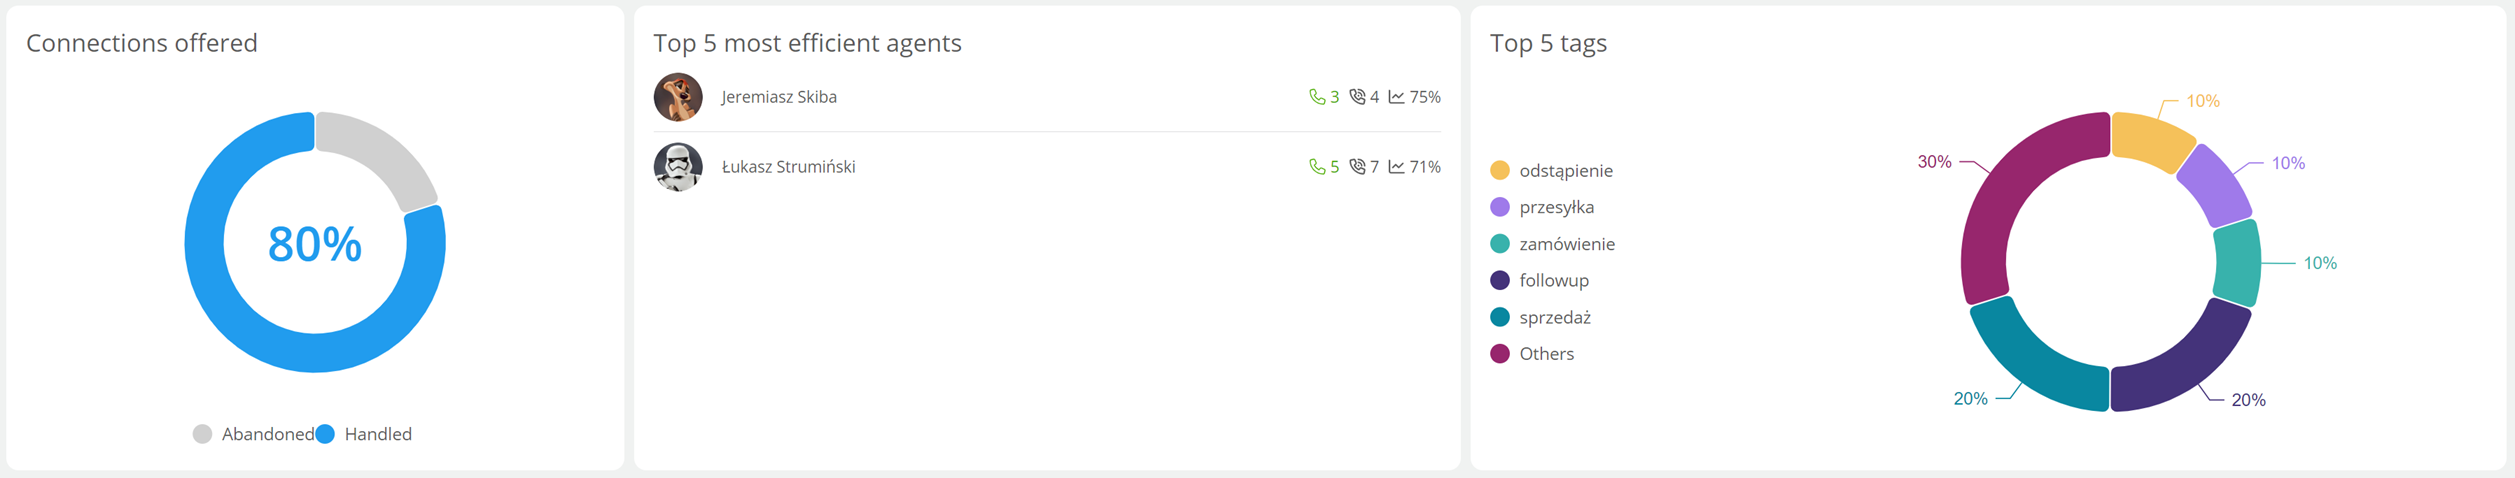
Connections offered indicates how many of the calls offered to Agents were answered by them, and how many were eventually abandoned by Customers. When you hover the cursor over a particular section of the graph, the specific number of calls in question will be shown.
The purpose of Top 5 most efficient agents is to identify those Consultants who have the highest call answering rate, or so-called Service Level Agent.
The Top 5 tags chart indicates the most frequently used tags within the Infoline service over a given period of time.
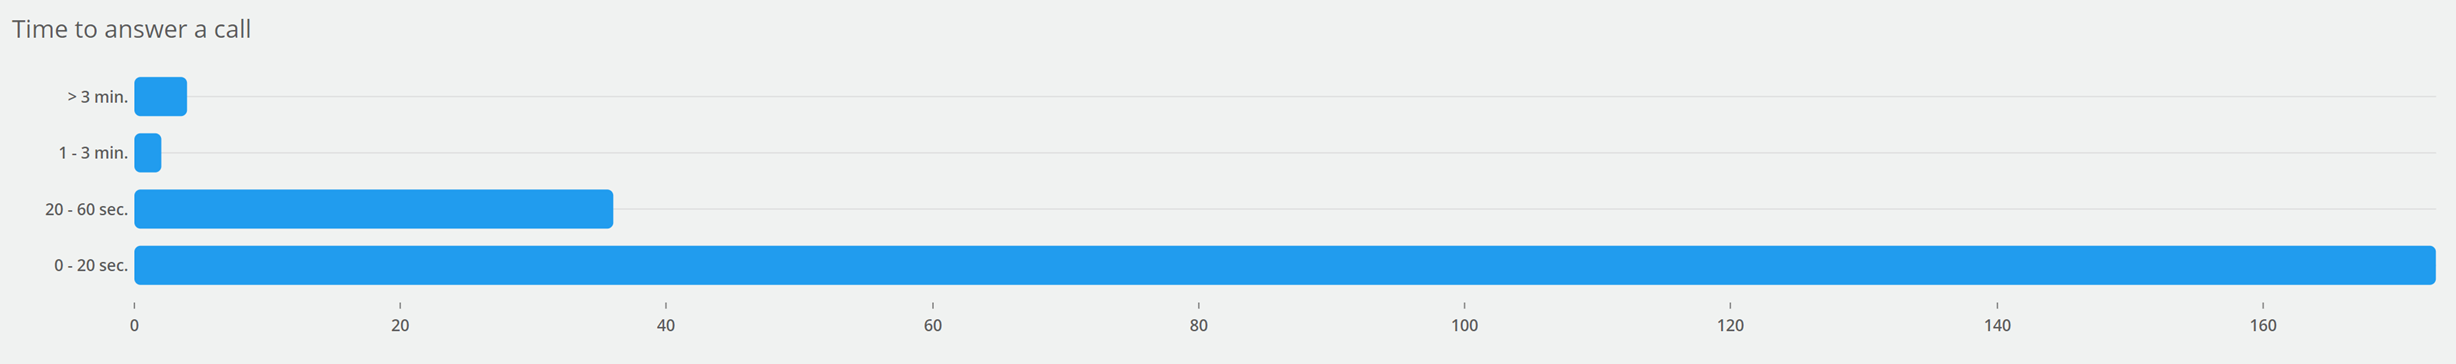
The graph Time to answer a call tells us in what time intervals from the moment the call entered the queue it was answered by the Agent. If you hover the cursor over a given bar, a specific numerical value will appear (how many calls were answered during that time).
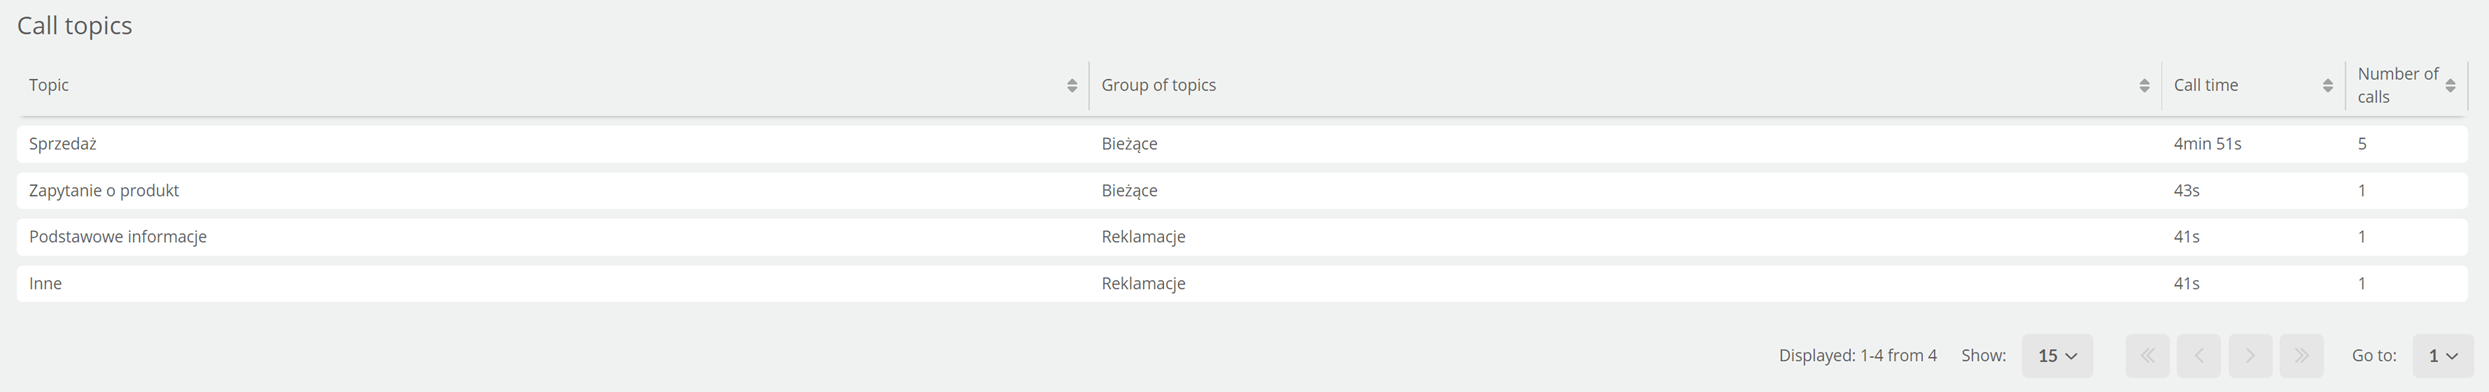
The Call topics summary collects the number of calls and their total duration for the calls marked with a specific topic. After clicking on  , you can sort the data by topic name, group, call duration or number of calls.
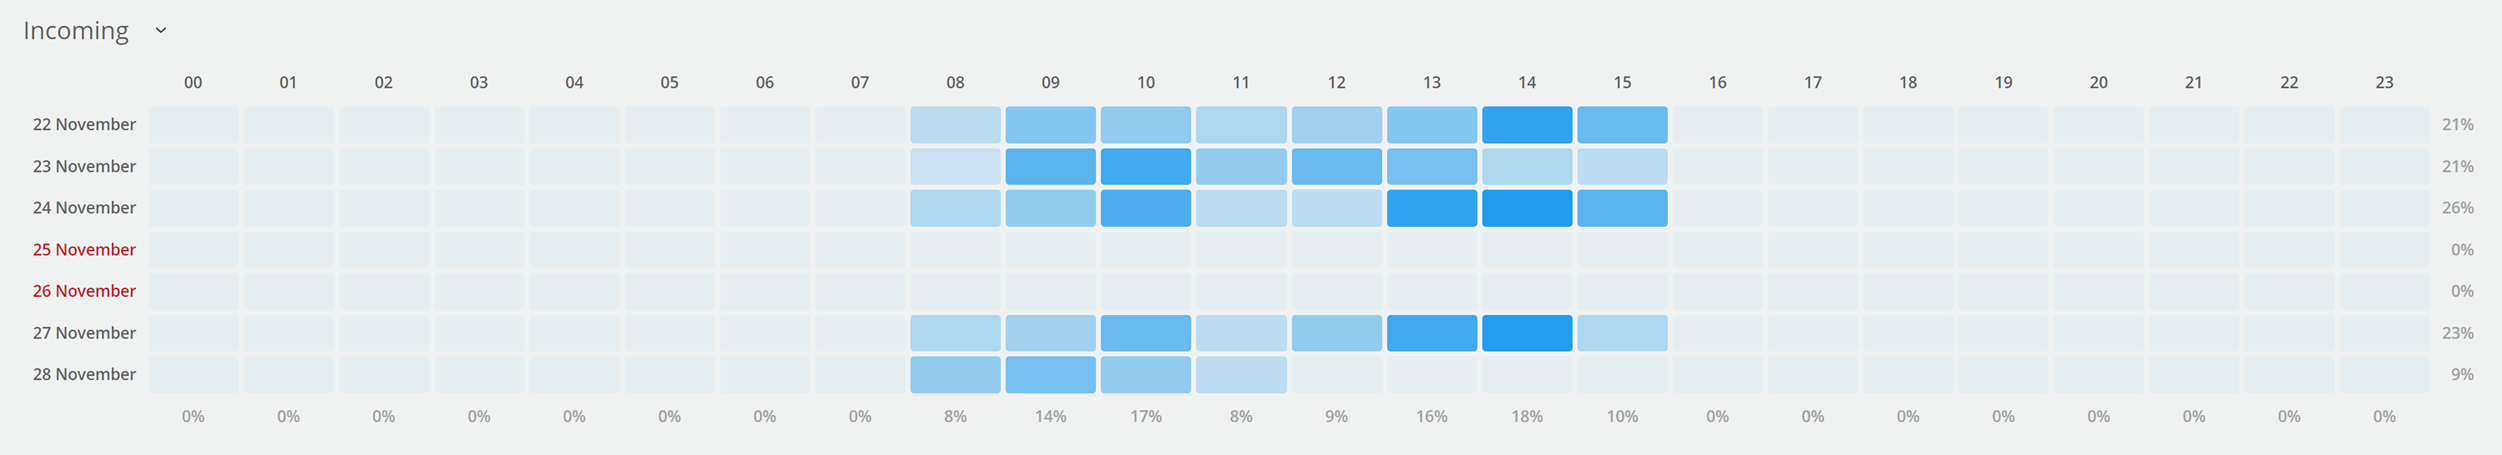
The Heat map above visually depicts the volume in this case of incoming calls that occurred on a given day in a specific hourly interval. Hovering over a given tile will show us the number of calls in a particular hour of the day under study. Vertically, we have the % share of the given hours in the studied time range to the total. Horizontally, the % share informs us what part of all incoming calls in the examined period are calls from a given day.
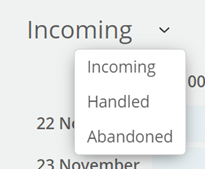
By hovering over  and clicking, you will be able to select Heat maps for other connection results, i.e.. Handled and Abandoned.
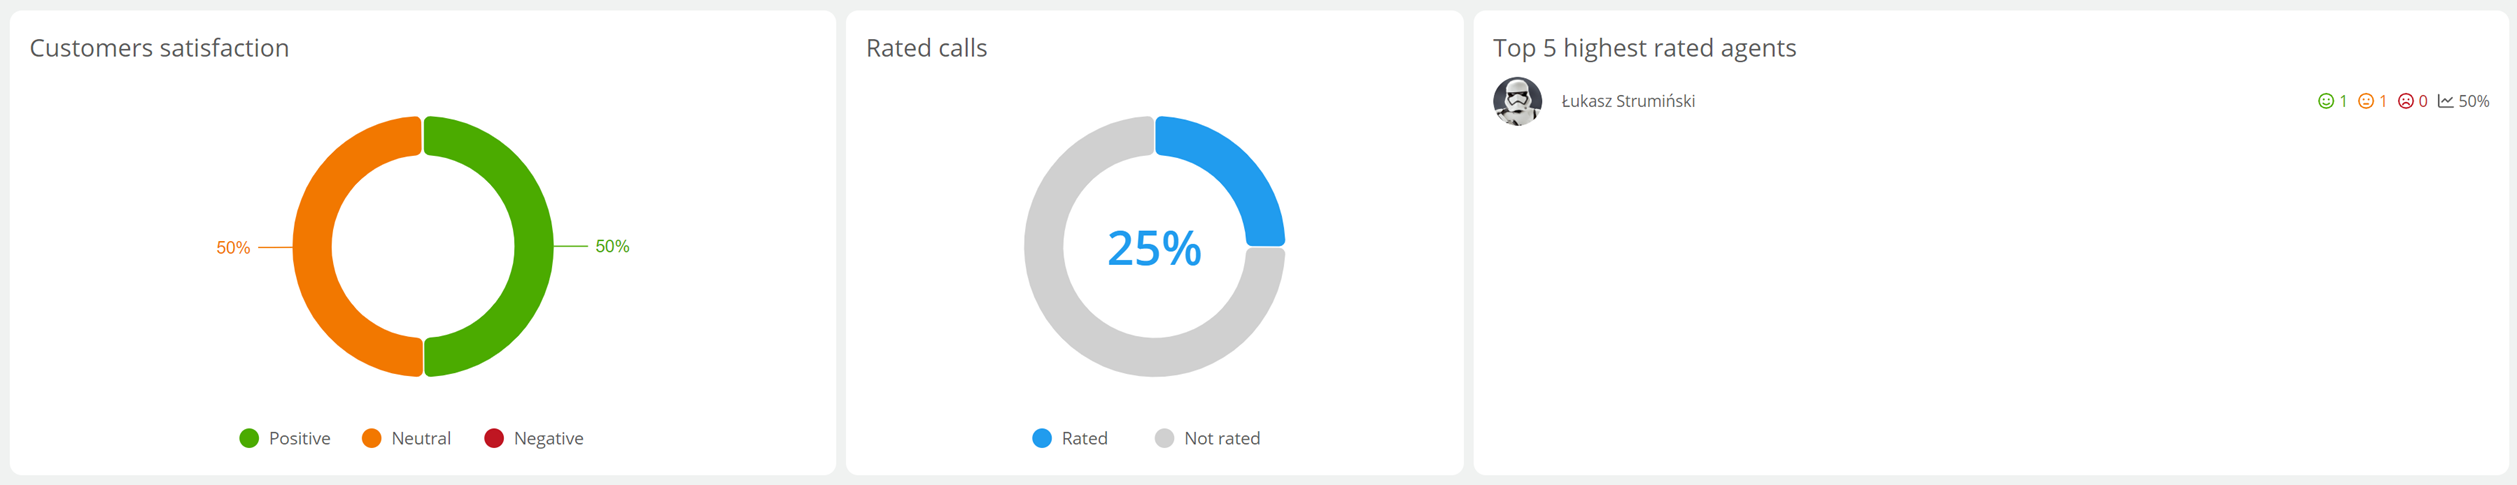
Customers satisfaction informs about the percentage distribution of call ratings from a given time period. When you hover the cursor over a given slice of the graph, the specific value (amount) of a given rating will be shown.
The Rated calls summary indicates the percentage distribution of rated and unrated calls. Its purpose is to indicate how readily your Agents' calls are rated by Customers.
The purpose of Top 5 highest rated agents is to identify those Consultants who have the highest satisfaction rate for calls handled by them.
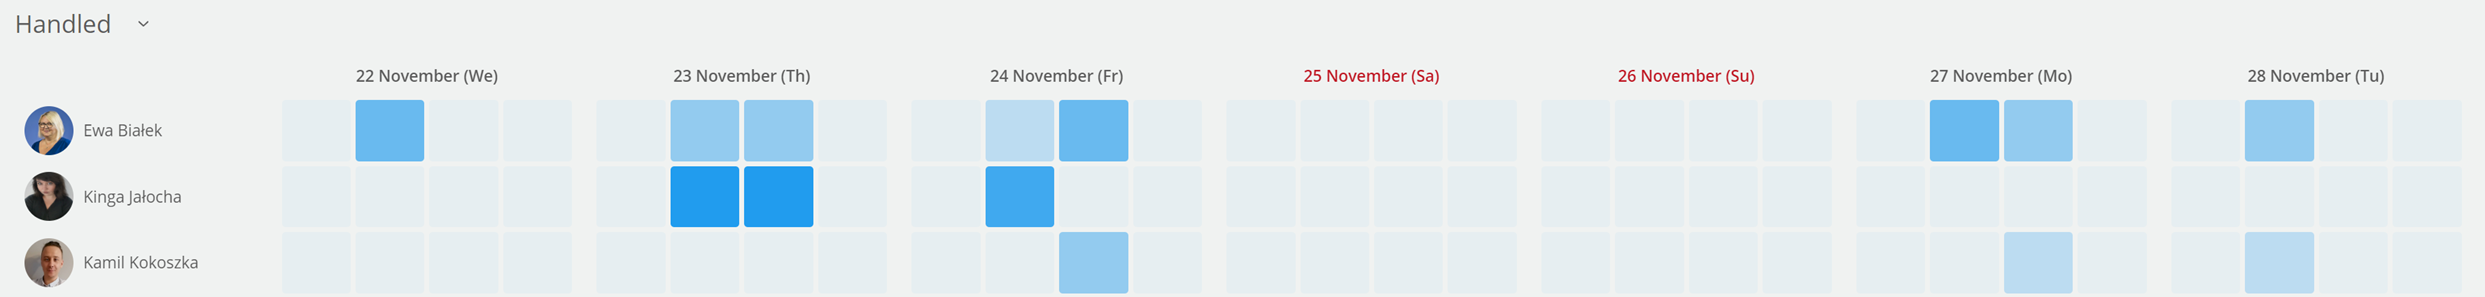
Another Heat map compiles for us, in this case, the Agents who received the call from a given period of time. If a given Agent does not appear in the compilation it means that there are no such calls handled by him that meet the given conditions. Each day is divided into four hourly sections, i.e. 0:00 - 05:59, 06:00 - 11:59, 12:00 - 17:59 and 18:00 - 23:59. In the case of Handled, the placement of the calls in question in the tiles depends on the date the call was answered.
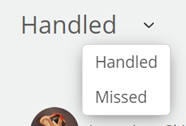
By clicking on  and clicking, you will be able to select Heat maps for another event i.e. Uncollected.

Share your opinion with us