Insights

Author: Łukasz Strumiński
Created: 2023-03-03. Updated: 2025-08-28.
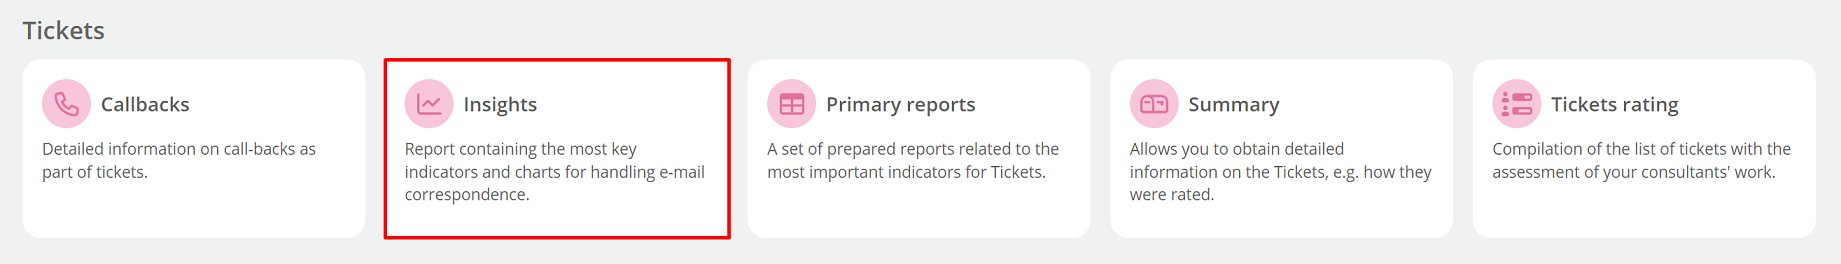
The Insights report provides a comprehensive analysis of key indicators related to the handling of Requests. Insights examines the methodology of working on tickets and allows to draw conclusions aimed at improving work on tickets. One of the unique advantages of this solution is the ability to study trends in comparison with the same previous period. To use this report, go to Reports → Tickets → Insights.
If you need to select a specific queue or queues, click on the  .
.
Insights defaults to display analytical data from the last 7 days, to change the time studied click on  .
.
Hint...🔎
The Insights report displays information for a maximum time period of 31 days. For the FCR indicator, the minimum time period is 7 days. The opening date means that the investigated submissions and their indicators are related only to those that originated during this time period.

- Number of new tickets - tickets that arose during the period under review,
- Number of closed tickets - tickets that are currently closed and were created within the analyzed time range,
- Number of opened tickets - tickets that are not currently closed and were created during the time period under review,
- Number of unassigned tickets - tickets that are not closed and are unassigned and appeared in the system in a given period of time,
- Average first response time - average time for the first response in business hours, for tickets generated during the time period under review,
- Average close time - average time for the first closure in business hours, for tickets that arose during the analyzed time period,
- First Contact Resolution (FCR) - % of tickets that closed with up to one Agent response and are further closed,
- Number of tickets closed with a user message - tickets that are currently closed and contained a message from the Agent,
- Number of tickets closed without user message - tickets that are currently closed and do not contain a message from the Agent,
- Number of messages per ticket - average number of incoming and outgoing messages per ticket,
- Number of incoming messages - total number of incoming messages in tickets,
- Number of tickets with user message - tickets that were created during the period under review and contained a message from the Agent.
Did you know...💡
First Contact Resolution is a parameter that determines the % of cases that were resolved during the first contact with a Consultant. It is considered one of the most important indicators for Contact Center.
For the above indicators there are visible trends, in the case of a value of "-" it means a decrease in such relative to the preceding period. If the indicator is with a "+" sign, the current value of the indicator is higher by a given value compared to the same preceding period. Trends for the number of tickets are expressed in percent, for times in hours; and for FCR in percentage points.
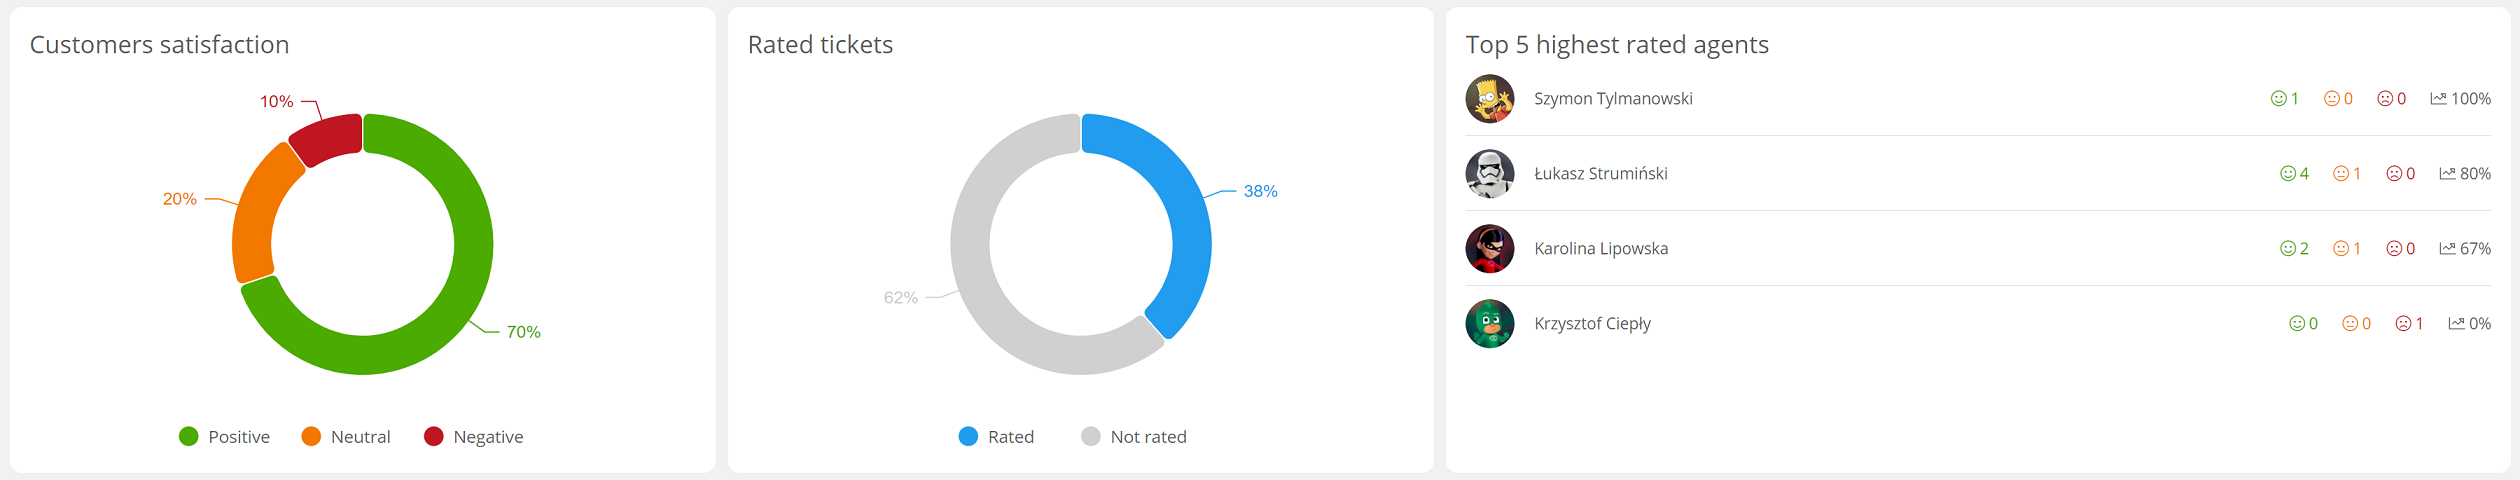
Customers satisfaction informs about the percentage distribution of assessments of tickets in a given period of time (where the ticket was created in such a period). If you hover the cursor over a given slice of the graph, the specific value (amount) of a given grade will be shown..
The Rated tickets determines the percentage distribution of rated and unrated tickets. Its purpose is to indicate how readily your Agents' responses are rated by Customers.
The purpose of Top 5 highest rated agents is to identify those Consultants who have the highest satisfaction rate for the tickets they handle.
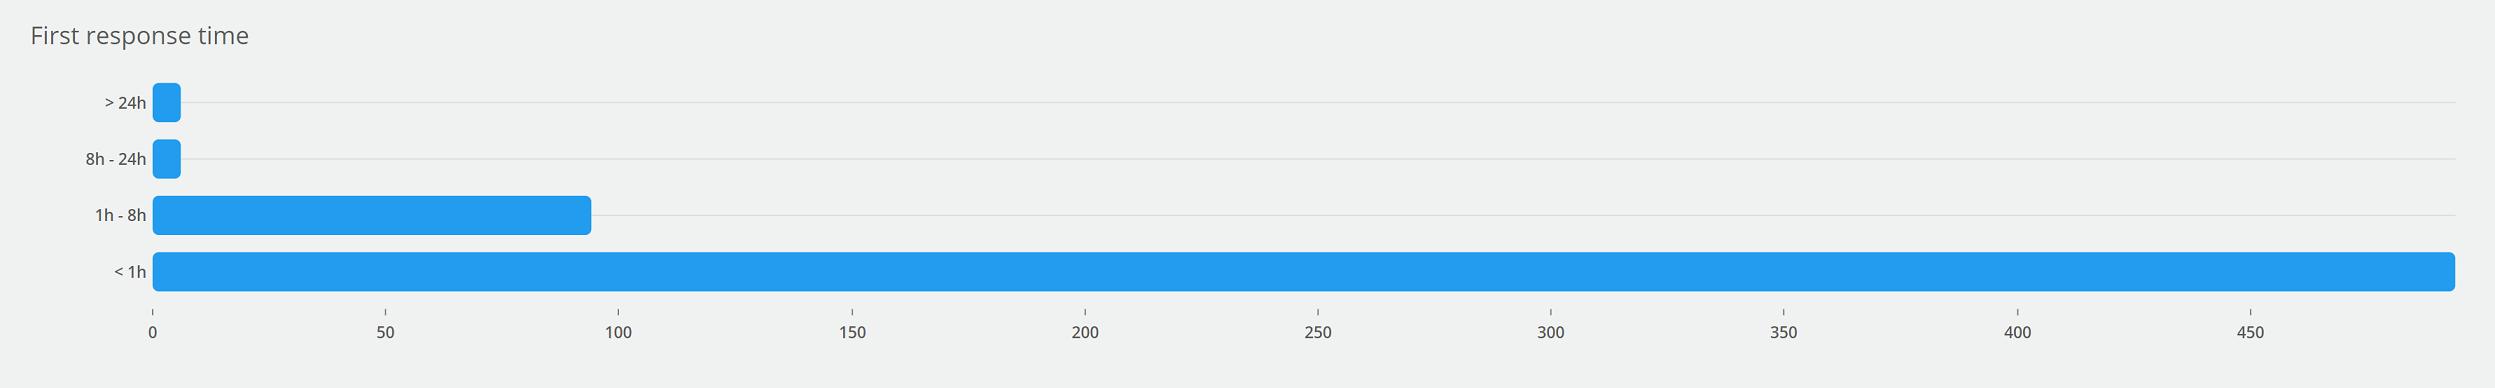
The chart First response time tells us in what time intervals from the moment the ticket was received within working hours was answered by the Agent. If you hover the cursor over a given bar, a specific numerical value will appear (how many tickets were responded to during this time).
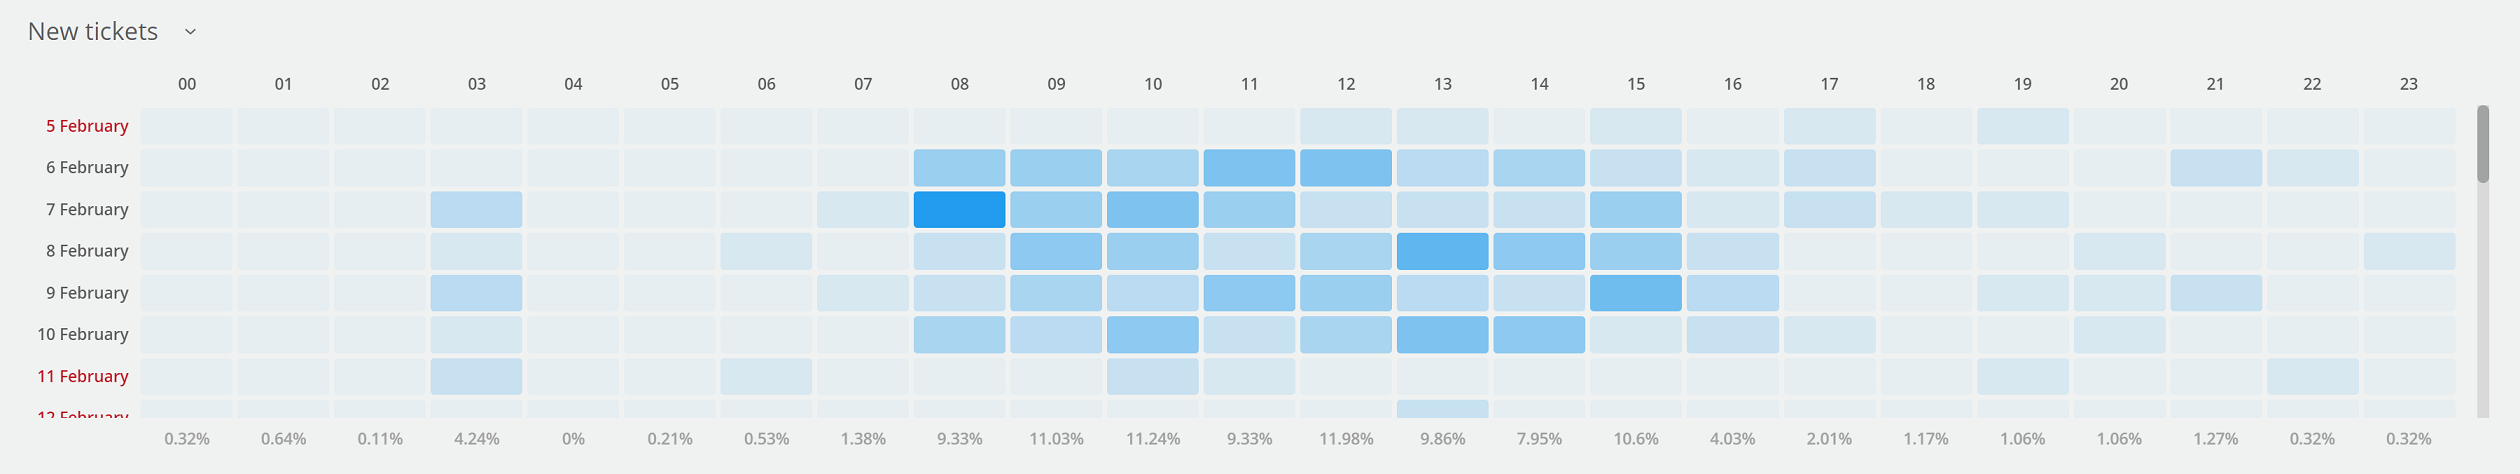
The Heat map above visually depicts the intensity, in this case, of new tickets that arose on a given day during a specific hourly interval. Hovering over a given tile will show us the number of tickets that arose during a specific hour of the day under study. Vertically, we have the % share of the given hours in the examined time range to the total. Horizontally, the % share tells us what part of all new tickets created in the examined period are the tickets of a given day.
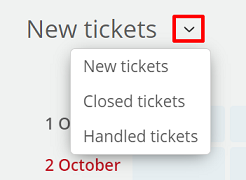
By hovering over  and clicking on it, you will be able to select Heat maps for other events, i.e., the following. Closed tickets and Handed tickets.
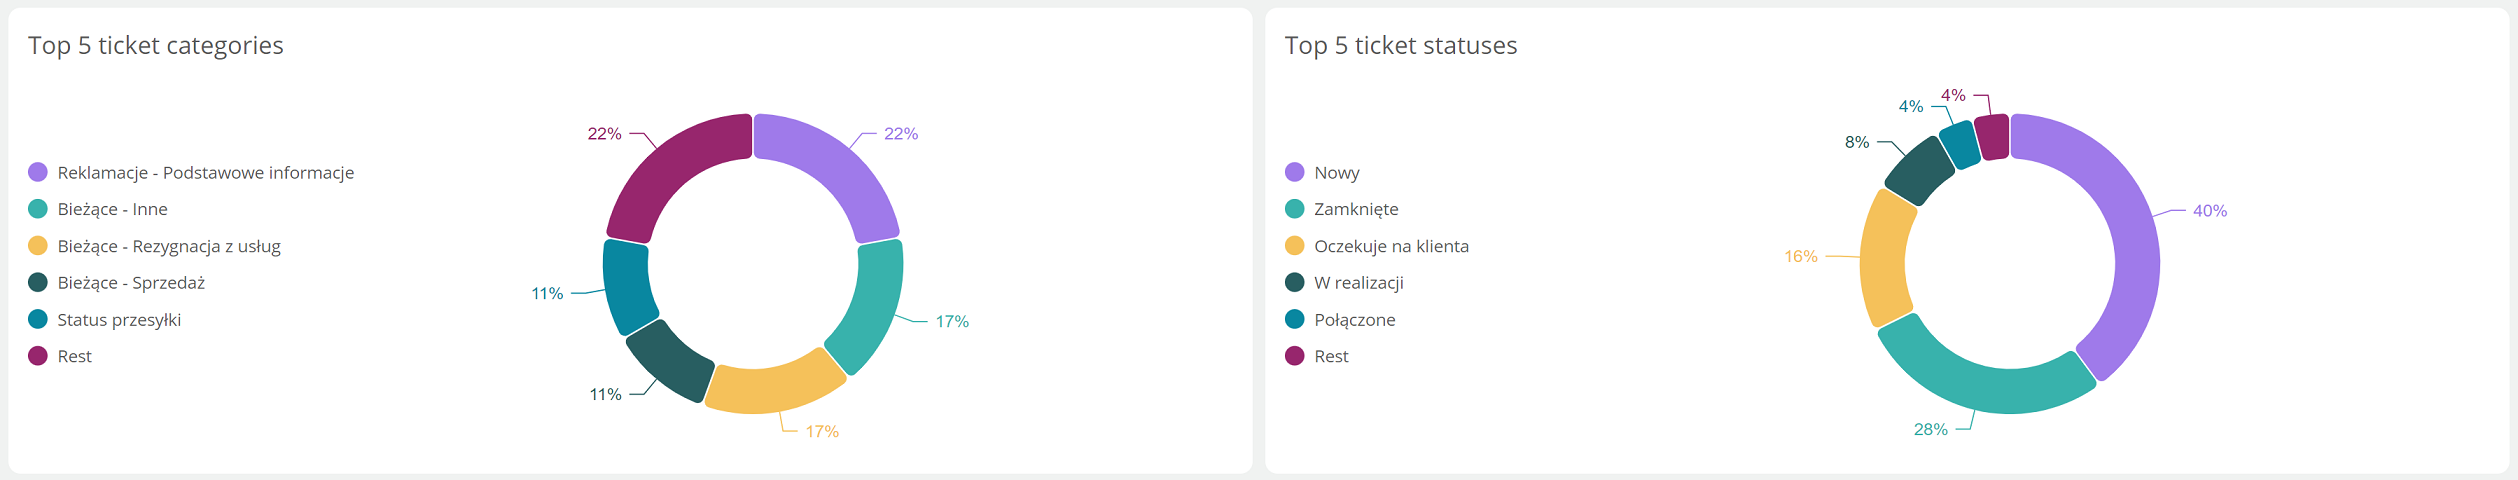
In the case of Top 5 ticket categories, the share of all selected categories for created tickets in a given period is collected. Categories that are not in the Top 5 are additionally collected as Other so that their share is visible in relation to the total. Similarly, the same is done for the other Top 5 charts.
Top 5 ticket statuses compiles the share of the most popular ticket statuses that are currently selected for tickets from a given time period.
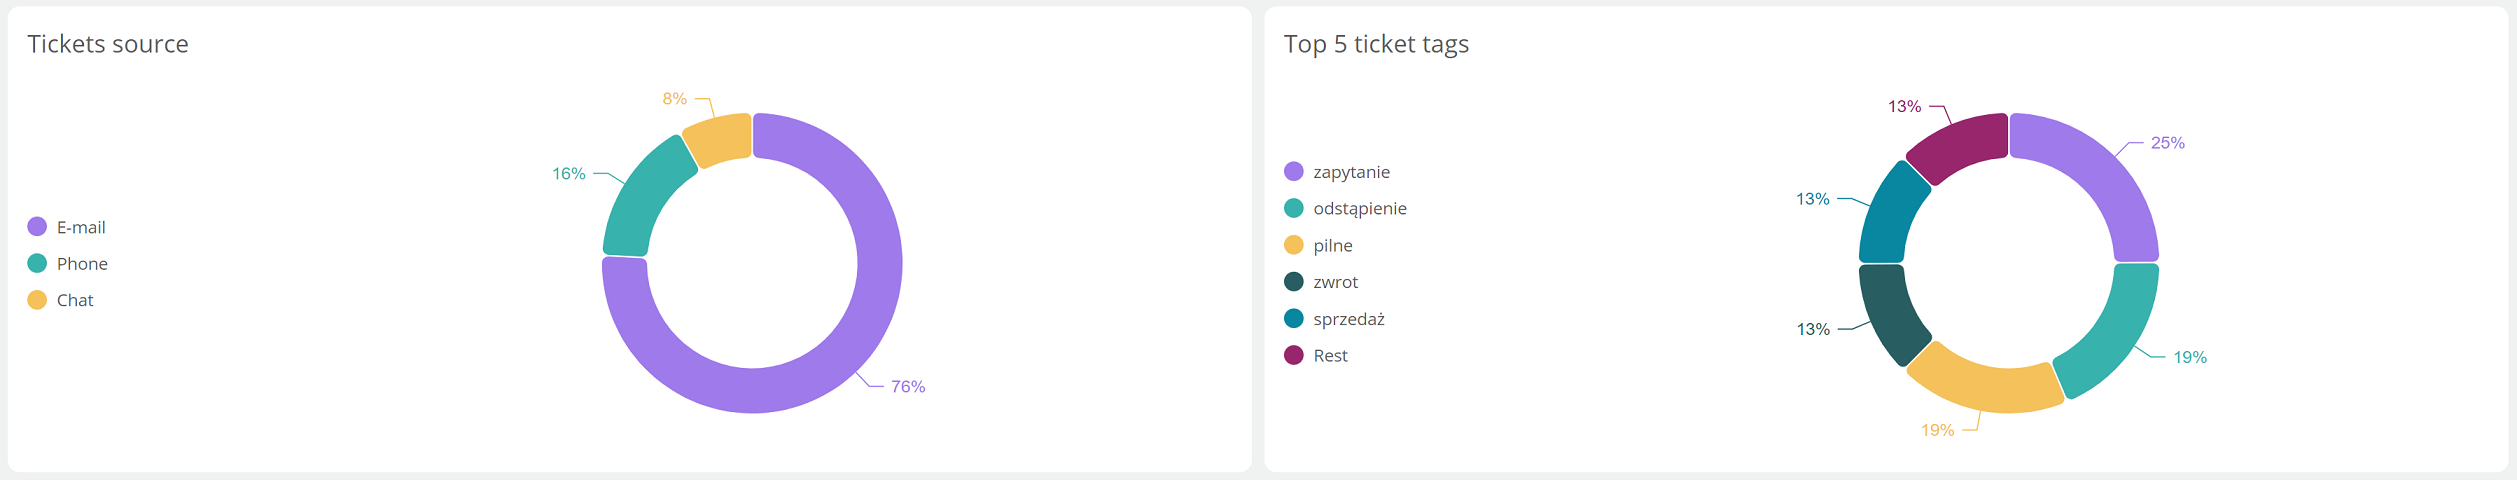
The Tickets source summary determines the percentage distribution of tickets created based on a given contact type. It allows you to determine what is the most common source that causes a ticket to be created.
The purpose of Top 5 ticket tags is to indicate the most frequently used tags within the created tickets over a given period of time.
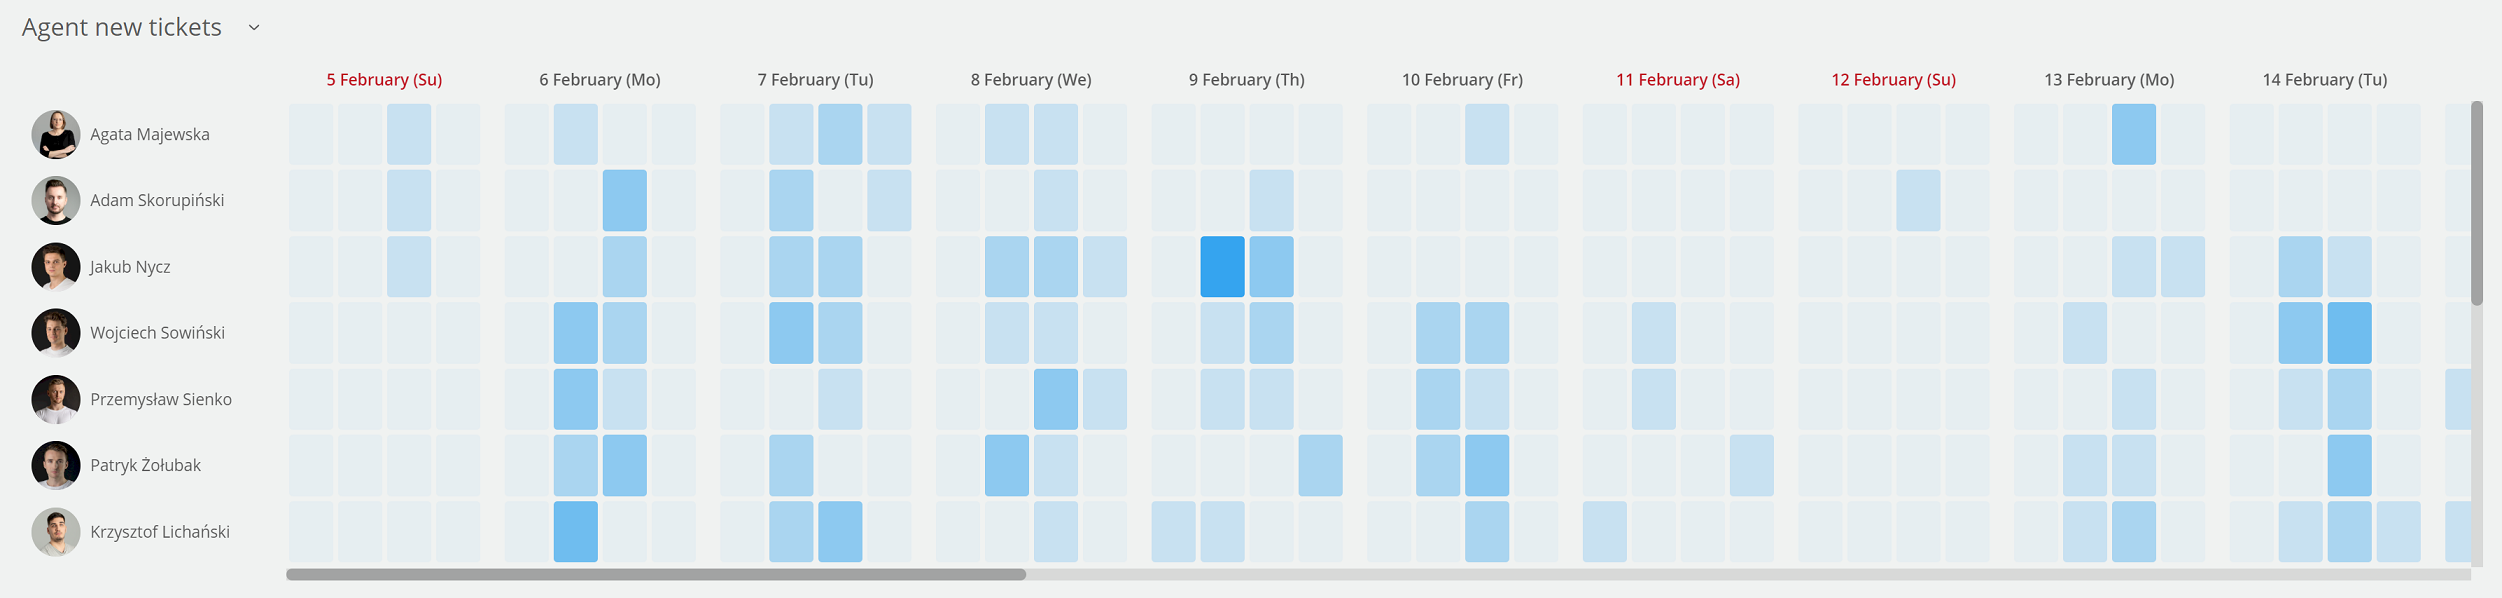
Another Heat map compiles for us, in this case, the Agents to which new tickets from a given time period have been assigned. If a given Agent does not appear in the listing it means that there are no such tickets assigned to it that meet the given conditions. Each day is divided into four hourly sections, i.e. 0:00 - 05:59, 06:00 - 11:59, 12:00 - 17:59 and 18:00 - 23:59. In the case of Agent new tickets, the placement of given tickets in the tiles depends on the date the ticket was created.
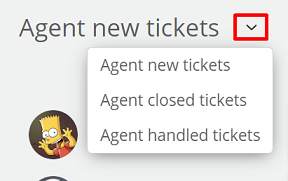
If you hover over and click, you will be able to select Heat maps for other events i.e.. Agent closed tickets and Agent handled tickets.

Share your opinion with us